

Say goodbye to hunting for scattered materials! Lerwee Documentation gets a full upgrade‑your always‑available user manual
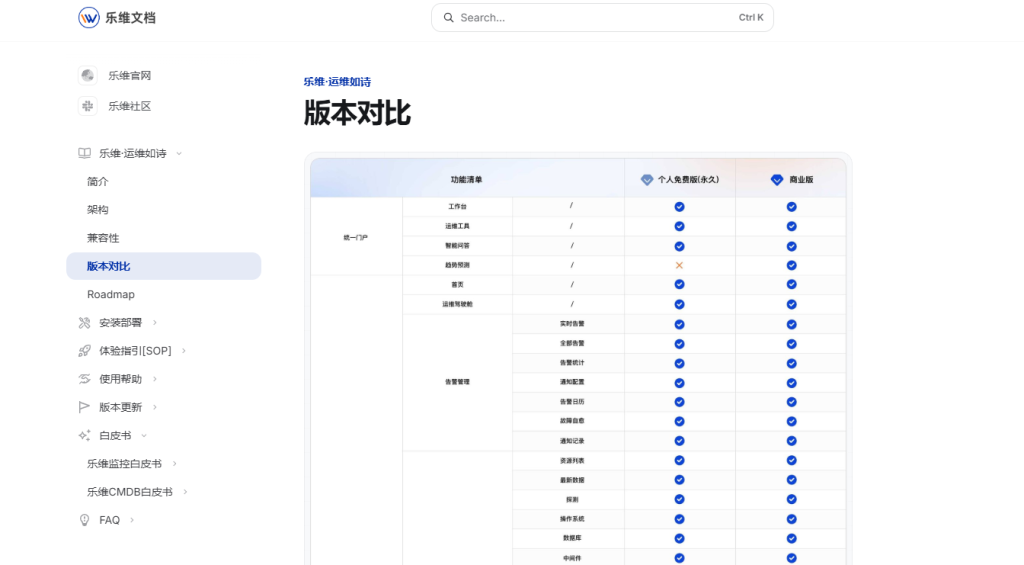
In the past, information was scattered across various sources, resulting in low lookup efficiency. Now the page reorganizes SOPs, FAQs, release notes, best practices and other content with a well‑defined navigation structure. Whether you are in project deployment, daily O&M or fault troubleshooting, this documentation page serves as a handy reference tool at your fingertips.
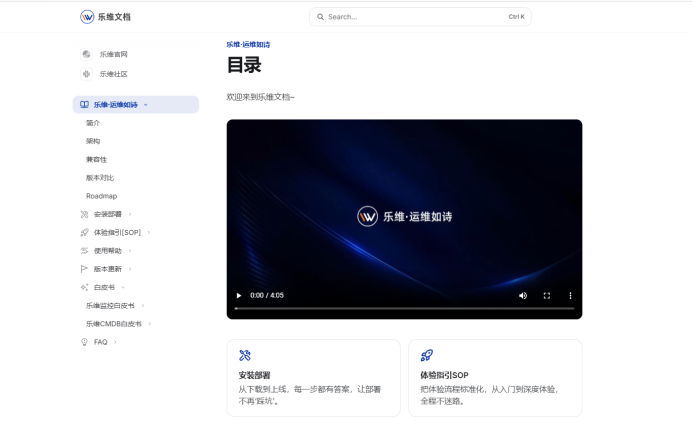
Page Visuals & Navigation: Better‑organized Information Hierarchy
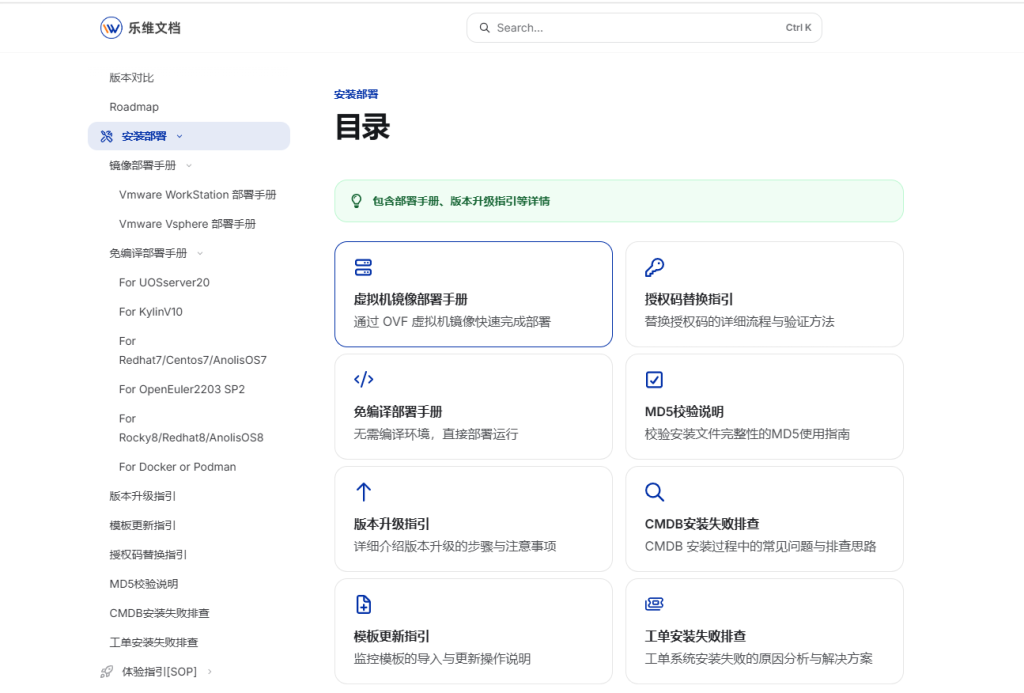
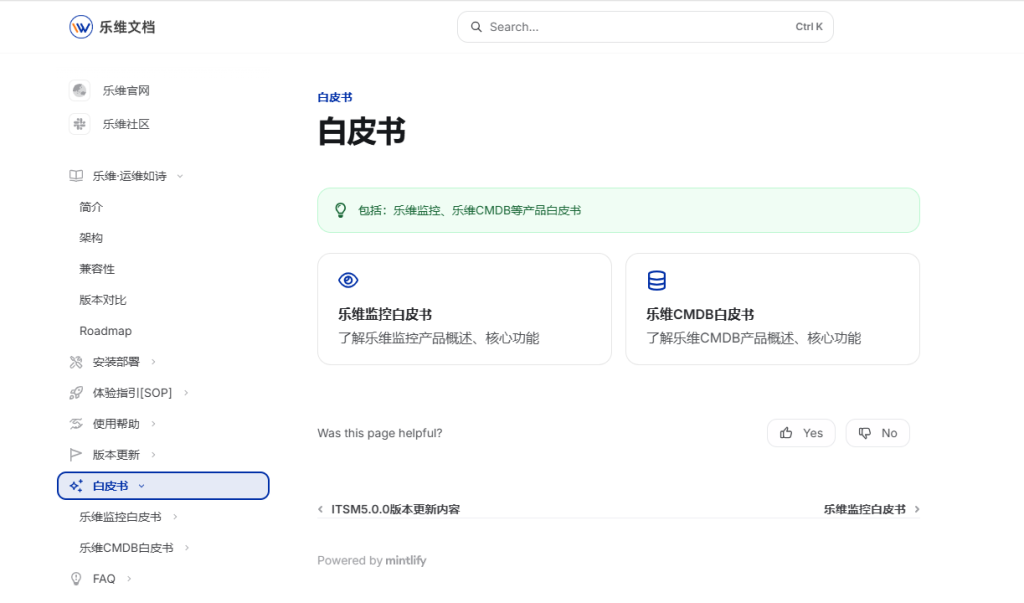
- Left‑hand navigation bar: Organized into major categories including Installation & Deployment, Experience Guide [SOP], Usage Help, Release Notes, Whitepapers and FAQs. Click to expand sub‑sections for quick access to target modules.
- Global top search box: Supports shortcut‑key triggered search. Enter keywords to look up documentation content.
- Main content display area: Supports multiple formats such as graphics, texts and videos. Product videos and operation tutorials can be played directly online.
SOP (Standard Operating Procedures): Standardize O&M Actions
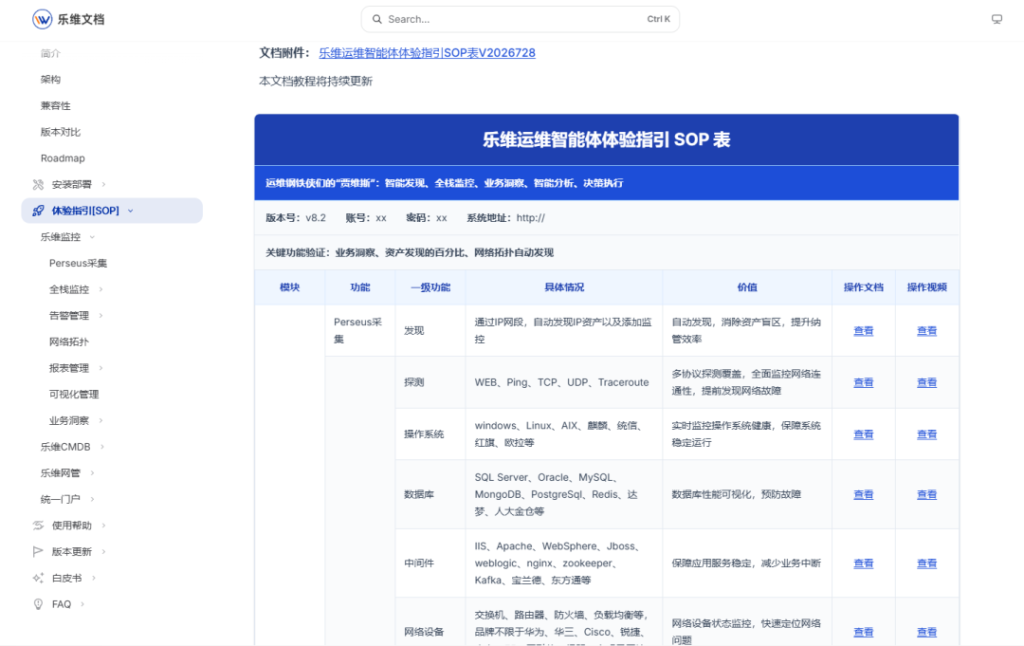
The Experience Guide [SOP] section gathers standardized operating procedures for core modules. Complete actionable SOPs are provided for Lerwee Monitor, Lerwee CMDB, Lerwee Network Management, Unified Portal and other product functions. Step‑by‑step guidance covers initial configuration and daily business operations.
Release Notes: Full Records for Every Iteration
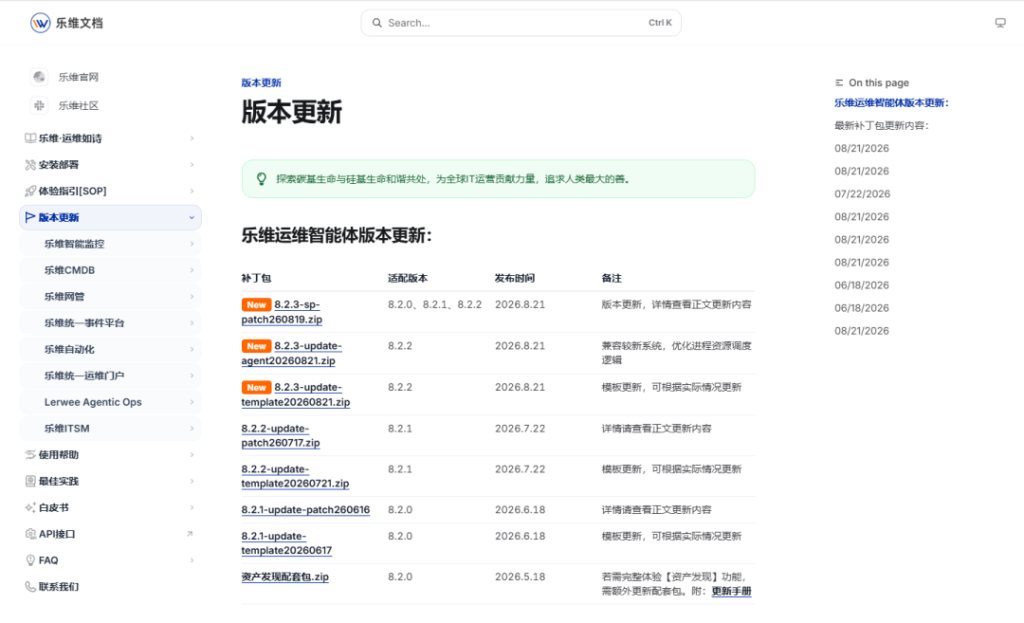
This section compiles all product iteration information, clearly listing patch packages, compatible versions, release dates and update remarks. Users can verify version compatibility before upgrades to avoid upgrade failures or system anomalies caused by incomplete version awareness.
- Module‑based update breakdown: Updates are split by product modules: Lerwee Monitor, Lerwee Network Management, Lerwee CMDB, Lerwee Automation and Unified Portal. New capabilities, function optimizations and bug fixes are explicitly displayed.
- Timeline‑style version history: All historical releases are sorted by publish date. Latest updates are pinned on top for fast review of newly‑released features, while past change logs remain traceable.
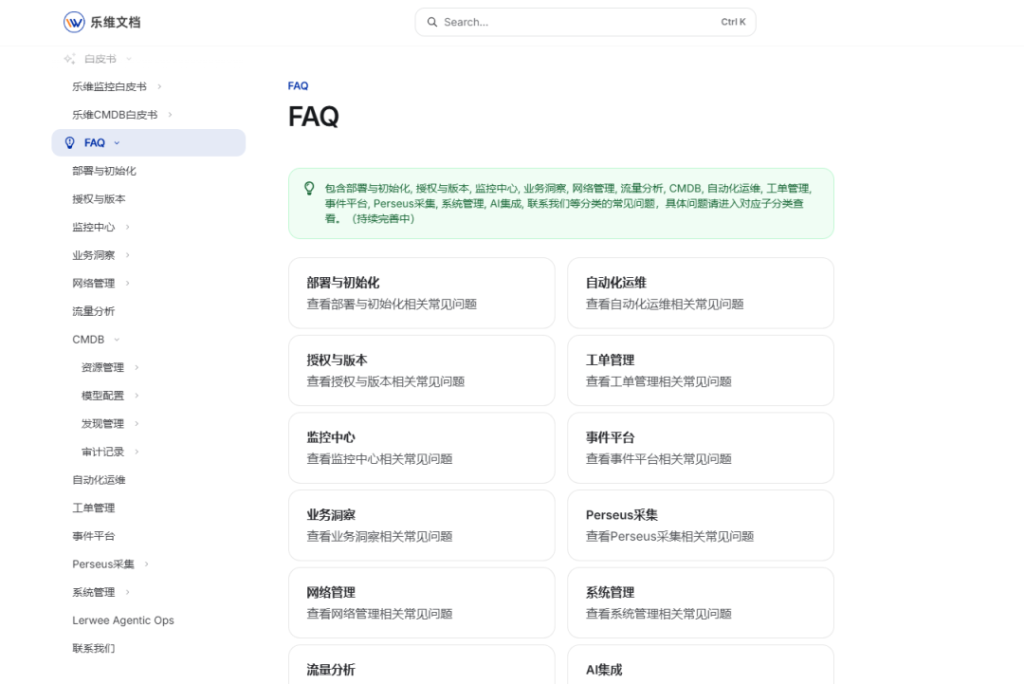
FAQ: Quick Access to Frequently‑raised Questions
The FAQ section covers categories: Deployment & Initialization, Licensing & Versions, Monitoring Center, Business Insight, Network Management, Traffic Analysis, CMDB, Automated O&M, Work‑order Management, Event Platform, Perseus Collector, System Administration, AI Integration. Content is updated on an ongoing basis. Click each category for details.
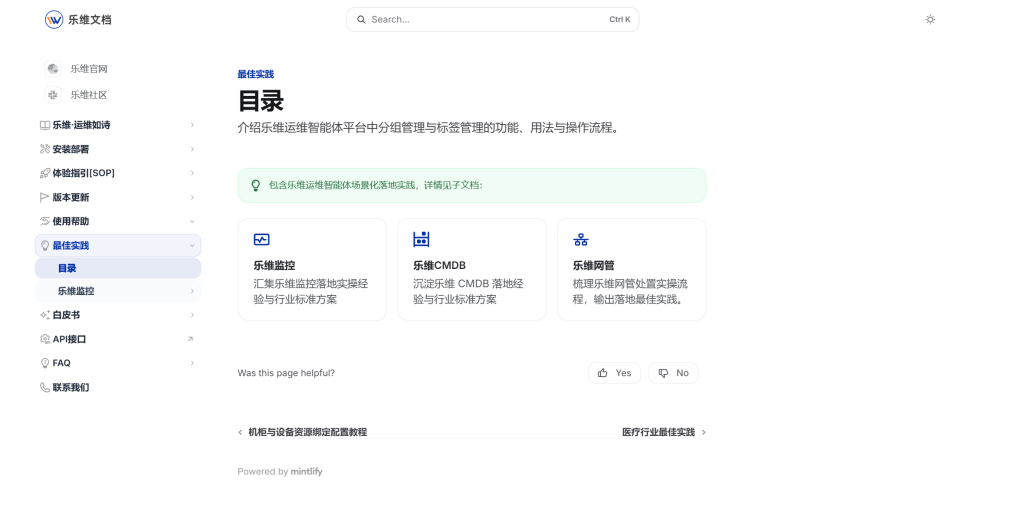
Best Practices: Real‑world Experience from Front‑line O&M
Best Practices draw on hands‑on experience accumulated by industry users in live production projects. It demonstrates reasonable asset organization via flexible categorization, and illustrates multi‑perspective O&M analysis ranging from global overview down to granular details.
Access Guidance
- For standardized deployment or procedure validation: refer to Installation & Deployment / Experience Guide [SOP] first.
- For operational questions: search by product category within FAQ.
- To track product enhancements: check the release‑note timeline regularly.
- To learn from proven real‑world solutions: get insights from Best Practices.
- For in‑depth professional materials: browse Whitepapers.
Feel free to reach out with your valuable feedback. The Lerwee Community will keep iterating and optimizing documentation based on user input.
This Lerwee Documentation update unifies fragmented O&M knowledge. Standardized SOPs, FAQ knowledge base, traceable release logs and real‑world best practices aim to be a practical assistant for O&M practitioners, helping you reduce pitfalls and streamline daily O&M work.

- Perseus Collection
- Better Monitoring, Here with “7” | Lerwee Monitoring V7.0 Released
- Unite as One, Forge New Tech Journeys | Lerwee LCS Intermediate Certification Training First Huangpu Session Successfully Concluded
- Private Sharing Session “Enabling AI to Truly Understand Enterprises” Suzhou Station Concludes Successfully
- How to replace SolarWinds to ensure enterprise IT security?
- Bid Farewell to Fragmented Tools! Transform O&M from Constant Switching to One‑Stop Unified Management
 Chinese (China)
  Chinese (Hong Kong)