


Focusing solely on device metrics leaves business health invisible? Leverage business insights for business-centric intelligent O&M
Conclusion First
Centered on business, business insight connects IT resources with business systems. It shifts O&M monitoring beyond device-level metrics to business-driven O&M management. Powered by advanced O&M platforms, fragmented data from O&M systems can be consolidated into a full business panorama view. This delivers a paradigm shift from “monitoring devices” to “monitoring business”, ultimately improving O&M efficiency and business continuity.
Applicable Scenarios
Suitable for environments with numerous business systems where a single business relies on multiple IT resources. When resource anomalies occur, device-only metrics are insufficient to assess business impact. A unified business-oriented monitoring perspective is required.
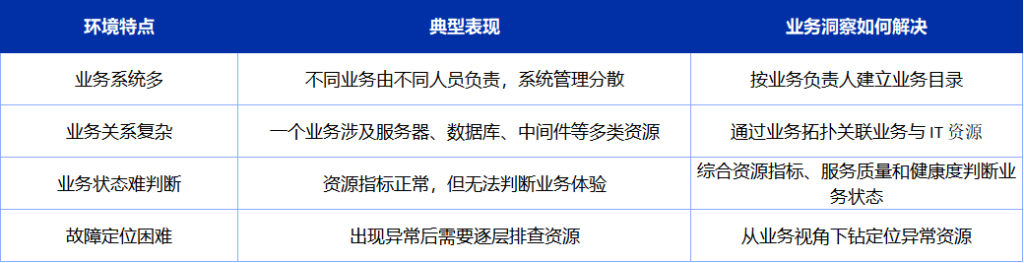
Why Build Business Insight
Pain points: Device-only monitoring shows metrics, but fails to interpret business impact. When alerts trigger, on-call staff only see IP addresses, hostnames and technical descriptions. The critical questions needing immediate answers are: Which business is affected? Who is in charge? Where should we check next?
- Device alerts cannot indicate business impact; priority relies solely on personal experience.
- One business depends on multiple types of resources, forcing engineers to switch between multiple views for troubleshooting.
- Resource metrics may appear normal while end-user business experience remains degraded, lacking business-side evaluation criteria.
- Business owners, vendors and resource ownership information are scattered in asset inventories. Time is wasted identifying responsible parties after alerts fire.
Device monitoring answers “Is there an alert?”. Business insight answers “Which business is impacted, who owns it, and where to continue investigation.”
Core Design Philosophy for Business Insight Best Practices
Adopt an organizational model: Business Owner → Business System → IT Resource. Assign owners to businesses first, map resources to corresponding businesses, then validate resource relationships and data collection scope.
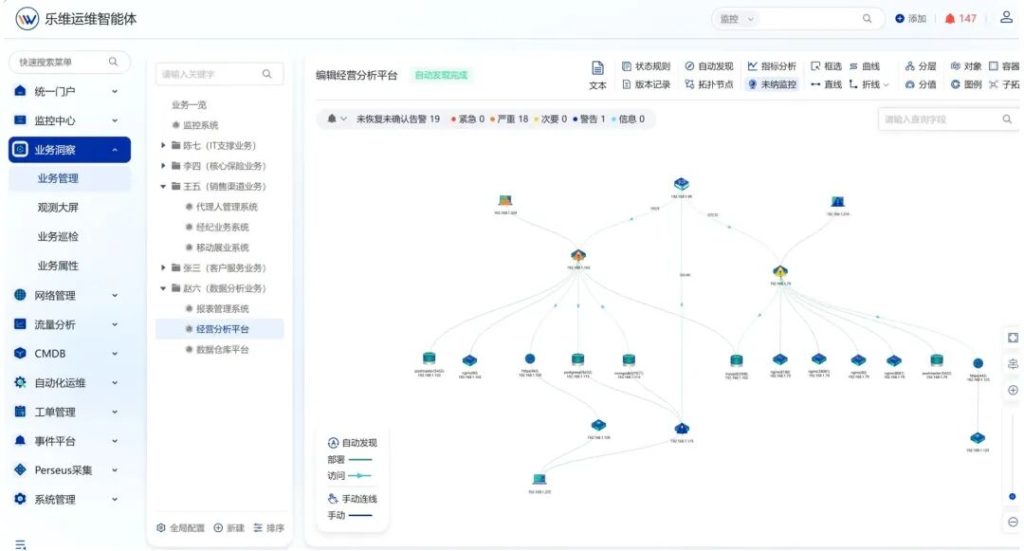
01 Design the Business Directory Tree
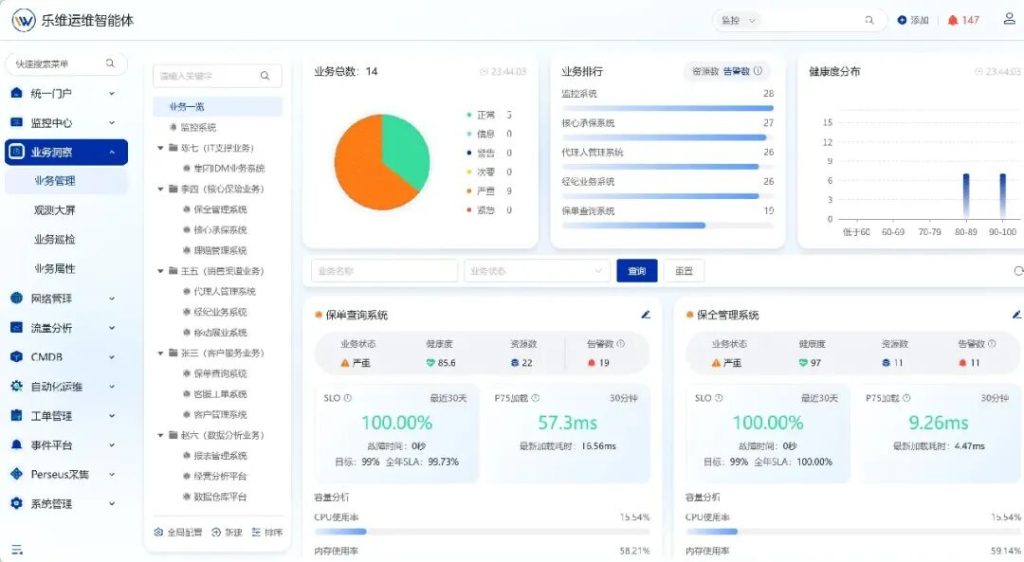
Build directories aligned with actual business management responsibilities. Business owners form the first-level directories, under which their respective business systems are grouped. When business anomalies arise, the directory itself defines accountability boundaries.
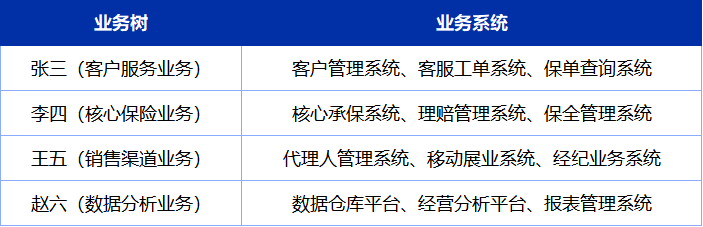
Configuration notes: Prioritize accuracy over completeness for the directory tree. Cover core businesses and confirmed owners first, then incrementally add other businesses.
02 Associate Business Systems with IT Resources
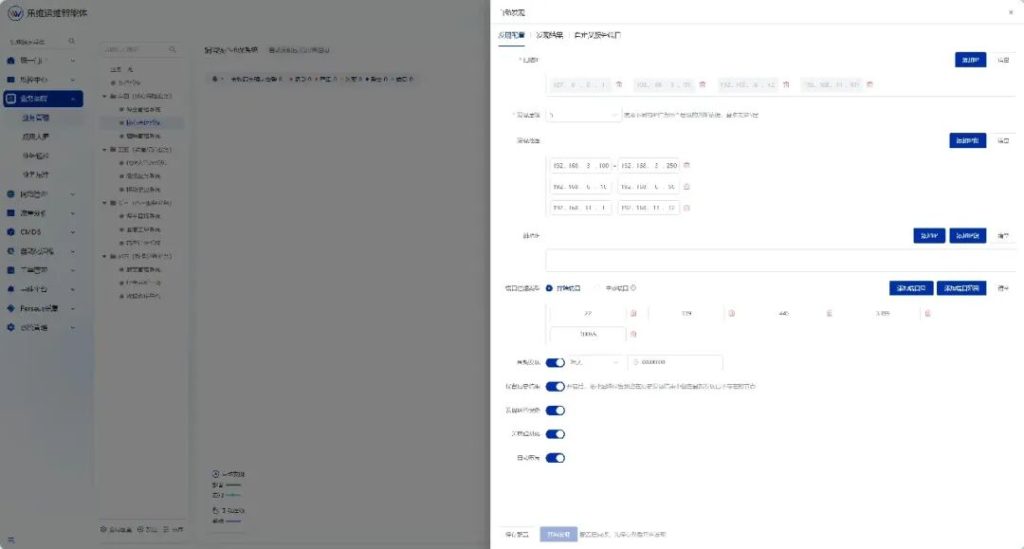
After designing the directory tree, interview business owners before enabling auto-discovery. Survey outcomes define discovery scope, resource ownership and calibration benchmarks.
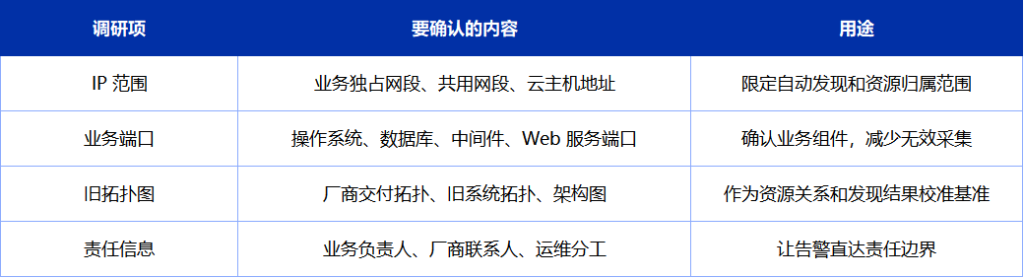
After configuring auto-discovery using surveyed IP ranges and ports, organize results following this workflow:
- Cross-reference with legacy topology: Do not directly use auto-discovery output as business topology. Validate resource completeness and ownership against vendor deliverables or old system topology.
- Supplement easily missed resources: Auto-discovery generally relies on traffic. Services listening locally only are often overlooked. Such critical resources need manual assignment to the corresponding business.
- Validate before attachment: Do not attach extra resources directly to the business tree. Confirm true business affiliation first. Resources with unclear ownership stay under monitoring and are assigned later.
- Control collection volume: If discovery returns excessive items, prune unnecessary IP ranges. Retain only business ports and core metrics sufficient for business impact assessment.
Implementation sequence: Confirm business owners → build business directories; survey resource scope → configure auto-discovery; calibrate core business resources → expand data collection scope.
Typical Use Cases
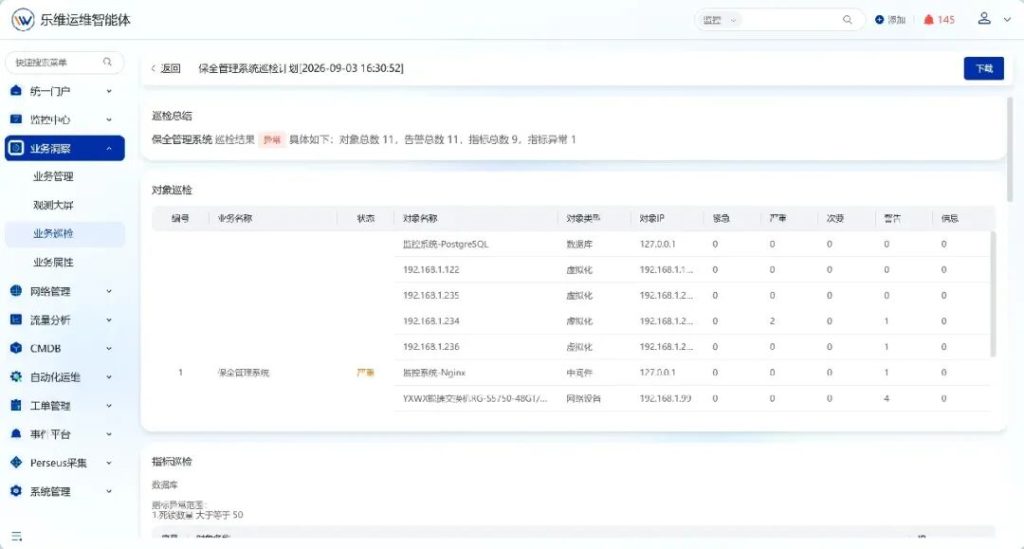
Scenario 1: Daily Inspection
Problem: Manual checks of individual hosts, databases and middleware are time-consuming and prone to missed critical items.
Solution: Configure daily inspections for core businesses, covering CPU, memory, file system, database deadlocks and other metrics.
Outcome: Review business health and anomaly lists first before drilling down into resources. Inspection standards are standardized and results traceable.
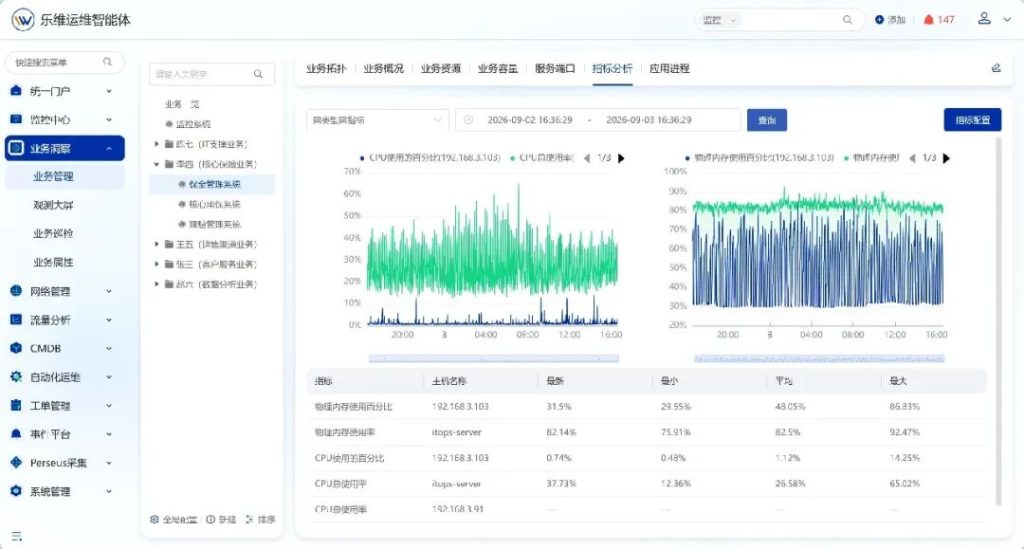
Scenario 2: Business Fluctuation Observation
Problem: Core businesses have distinct peak and off-peak periods, making abnormal fluctuations hard to detect in a timely manner.
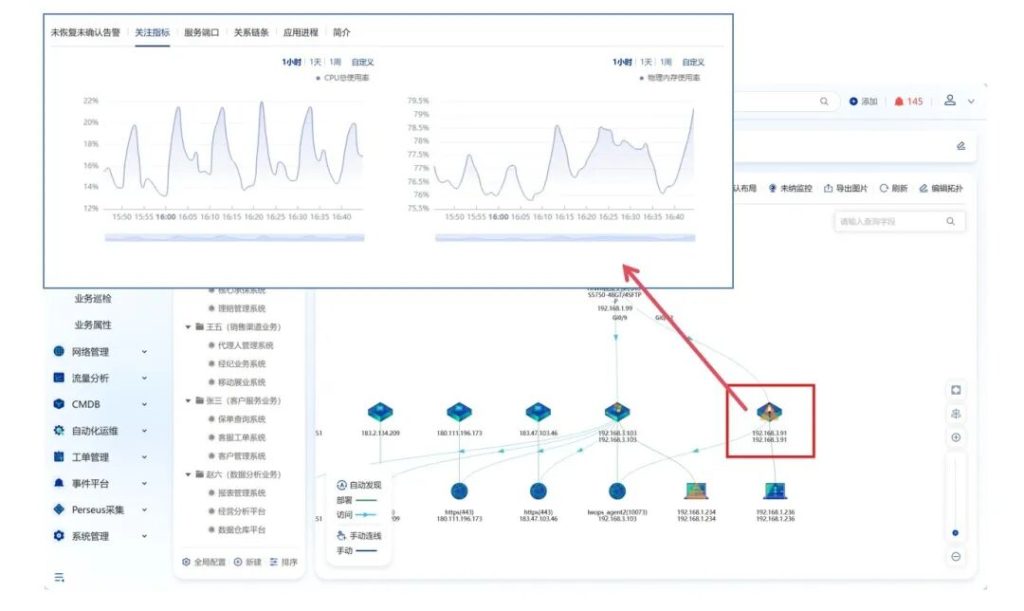
Solution: Aggregate key metrics including CPU, memory and file system utilization by metric type, display 24-hour trends, and compare against historical baselines.
Outcome: Visually identify daily peak hours and abnormal fluctuations to support resource adjustment and risk prediction.
Scenario 3: Rapid Troubleshooting for Business Anomalies
Problem: When business performance degrades, engineers need to determine whether the root cause lies in the business application, host, database or middleware.
Solution: Open the business topology of the affected business, view associated resources and their metrics, then drill down layer by layer to locate anomalies.
Outcome: Narrow down fault scope quickly from the business perspective and eliminate the need for device-by-device investigation.
- Lerwee Encyclopedia: Why Zabbix Wins Favor Among O&M Firms Worldwide?
- Unite as One, Forge New Tech Journeys | Lerwee LCS Intermediate Certification Training First Huangpu Session Successfully Concluded
- Lerwee NMS vs. Solarwinds NPM: Network Performance Monitoring (Part 1)
- Overwhelmed by a large number of monitored objects? With Lerwee Directory View, assets can be clearly categorized, easily managed, and quickly located.
- Stop manually extracting OIDs! Convert MIBs into importable monitoring templates in 3 steps
- Private Sharing Session “Enabling AI to Truly Understand Enterprises” Suzhou Station Concludes Successfully
 Chinese (China)
  Chinese (Hong Kong)