

Alerts Overload with No Clear Impact Scope?Tree for boundary governance, graph for status visualization — Locate faults at a glance with network topology
Conclusion First
Network topology is not just a fancy architecture diagram. It is an O&M view that organizes network zones, sites, devices, links and responsibility boundaries, supporting monitoring, drill-down and permission control.
Applicable Scenarios
Ideal for multi-site, multi-zone, multi-vendor environments with cascaded headquarters and branches, such as transportation, power, finance and large group enterprises. In these environments, network relationships rely on static drawings and personal memory, which leads to inaccurate fault localization and permission management.
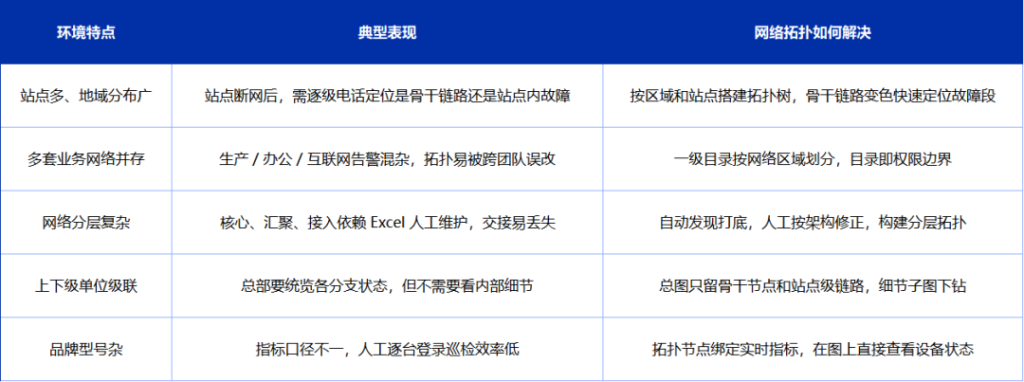
Why Build Network Topology
When network structures are stored in Excel spreadsheets and engineers’ personal knowledge, troubleshooting during nighttime site outages depends entirely on phone calls. On-call engineers receive simultaneous alerts for switch outages, link timeouts and application unavailability, yet have no visibility into device connections, port status or impact scope. They have to verify issues step by step from remote sites and carriers back to the core data center, often spending more than 30 minutes just to isolate the fault.
Common pain points:
- Slow fault localization: Link dependencies rely on memory and phone triage. Average troubleshooting takes over 30 minutes, with high risks of misjudgment and incorrect task assignment.
- Unclear accountability: Cross-team accidental edits to topology lead to blame-shifting after failures.
- Unassigned leased lines: Links owned by separate organizations, with no responsible party when outages happen.
- Tedious inspections: Engineers must log into multi-vendor devices one by one, spending half a day while missing potential issues.
Network topology unifies fragmented link relationships, real-time status and responsibility boundaries into a single panoramic view for direct troubleshooting.
Core Design Philosophy
Trees manage boundaries and ownership; graphs manage structure and status. Tree hierarchies align with troubleshooting workflows and permission granularity. Graphs adopt a layered design: overview for macro inspection and subgraphs for drill-down analysis.
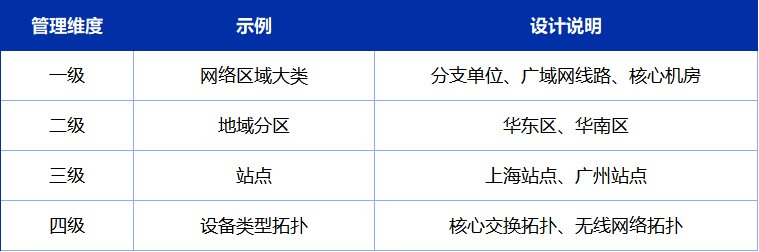
01 Design the Network Topology Directory Tree
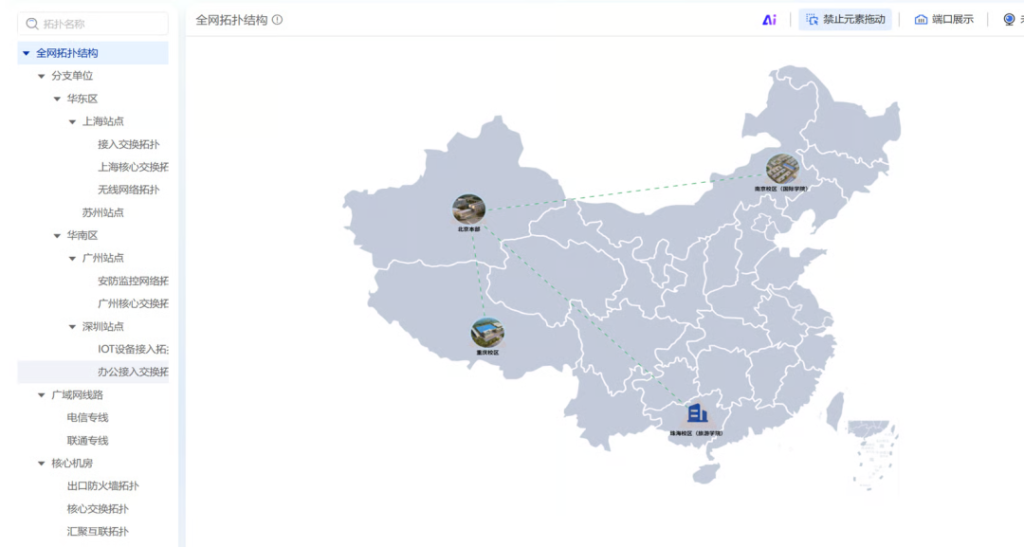
Design principle: Troubleshooting follows the path: zone → site → device type. Each tree level corresponds to one step. Directories define permission granularity; permissions are assigned by directory instead of per graph. A dedicated public directory is created for WAN leased lines to resolve ownership disputes between endpoints.
02 Calibrate Actual Connectivity
Workflow: Survey & inventory → auto-discovery baseline → manual gap filling → layered graph construction + metric binding
- Survey: Collect up-to-date network architecture diagrams and device inventories (IP addresses, SNMP community strings, models), and confirm leased line routes.
- Auto-discovery baseline: Configure discovery ranges based on core network segments (IP ranges + SNMP credentials) to generate initial topology.
- Manual correction: Add missing nodes and links per architecture drawings for connections not captured by auto-discovery.
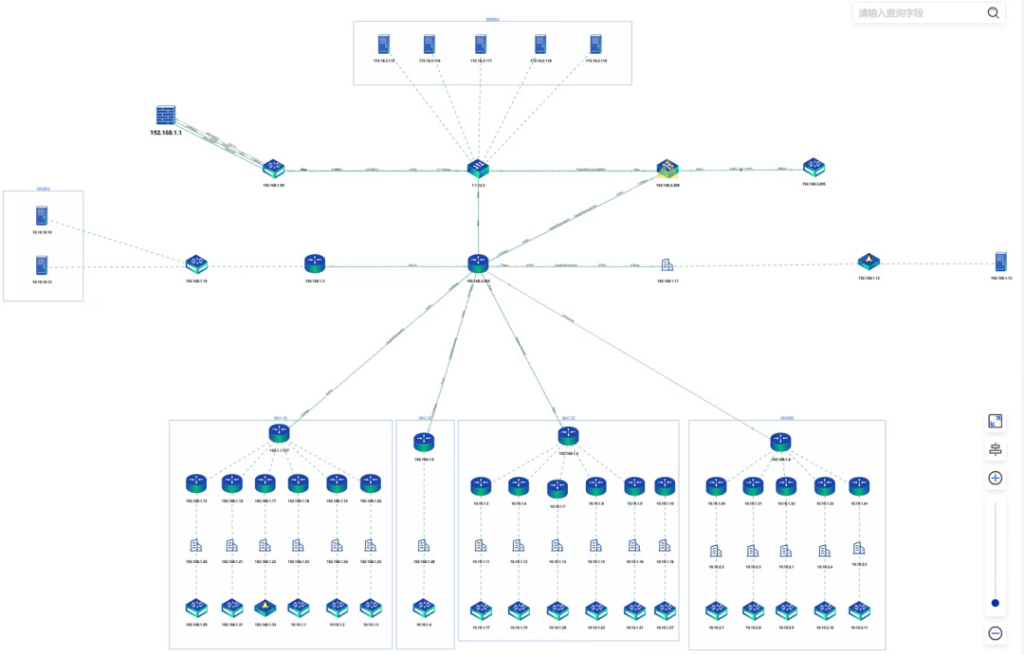
- Layered graph building: The overview graph contains only backbone nodes (≤30). Access layers and server zones are split into subgraphs with node drill-down capability.
- Link metric binding: Links are associated with port status and bandwidth utilization on both ends. Link colors change automatically when thresholds are breached.
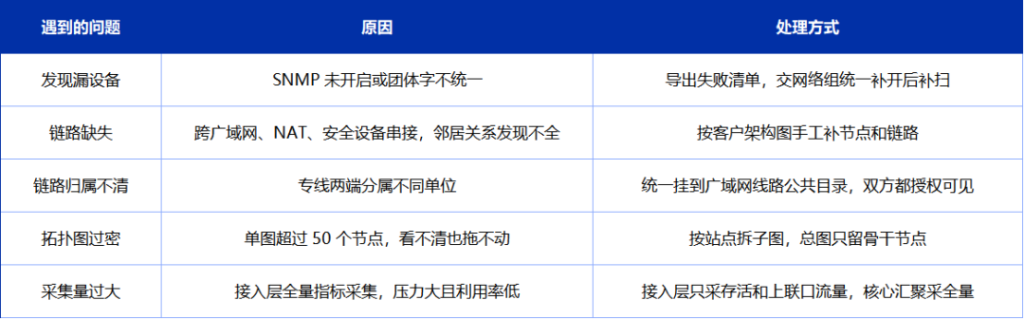
03 Common Issues & Mitigations
Typical Use Cases
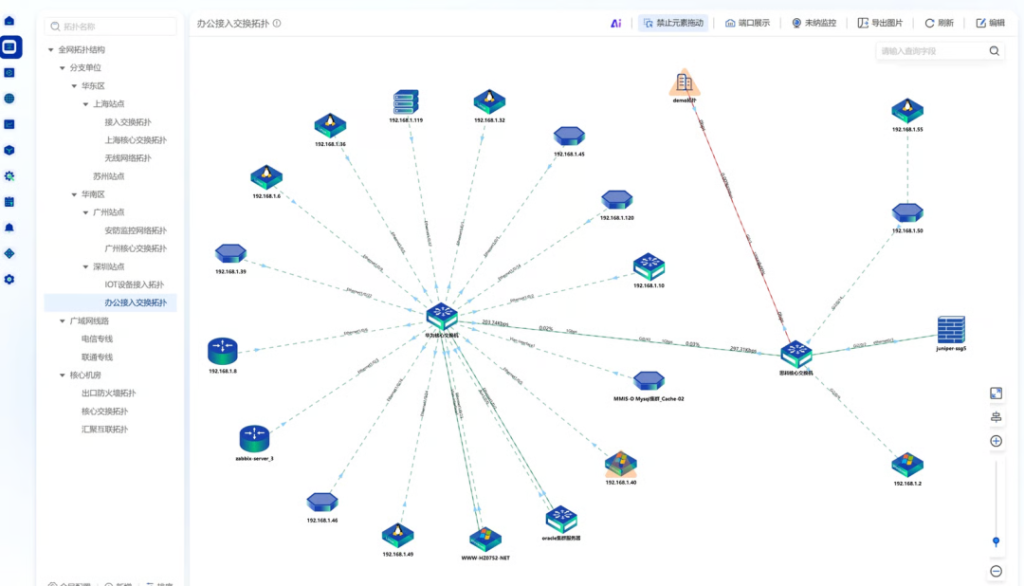
Scenario 1: Backbone Link Fault Localization
Problem: Dozens of sites are managed under the platform. When one site goes offline, engineers can only make phone calls to verify whether the fault lies with the leased line or the on-site infrastructure.
Solution: Leased line connections between all sites are plotted on the topology map. Each link is bound to port status and real-time traffic metrics from both ends. Links turn red automatically upon outages or threshold violations.
Scenario 2: Topology Permission Management
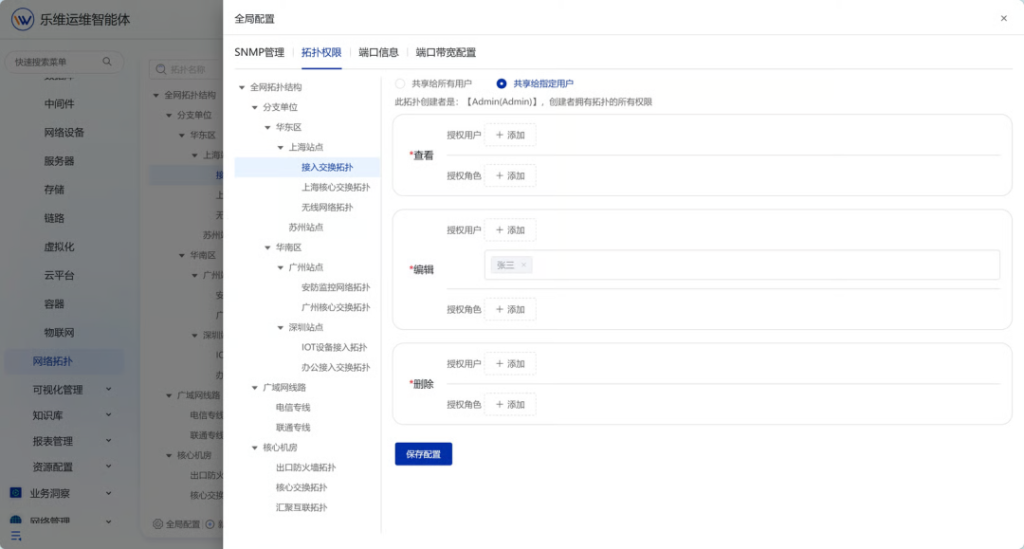
Problem: One shared topology graph open for editing company-wide. When Team A drags elements during troubleshooting, the link layout of Zone B gets disrupted. Accidental deletion corrupts the whole graph. Teams suspect each other during incidents with no audit trail to identify the modifier. Teams have to impose a “no edits unless necessary” rule, making the topology a static ornament that no one dares to maintain.
Solution: Tier-1 directories are divided by network zones, and directories serve as permission boundaries. Teams can only edit graphs within their assigned zones; unauthorized operations are blocked. All modifications are automatically logged, clearly showing who made changes, what was modified and the timestamp.
- Visualized O&M Monitoring | Make Faults Visible, Locatable and Controllable
- Lerwee 8.1 Launch: Multi-Module Deep Optimization for Intelligent O&M
- SSL Certificate Automation: Total Game-Changer
- Fully open all functions | Lerwee O&M intelligent agent free version out now
- 30+ Open-Sourced CoT Templates Cover 90% of High-Frequency O&M Scenarios: Lerwee Agentic Ops Empowers Truly O&M-Savvy AI
- From Firefighting Operations to Autonomous Operations: What Problems Do Operation AI Agents Solve?
 Chinese (China)
  Chinese (Hong Kong)