

Case Study: O&M Monitoring Platform for a Tertiary General Hospital in Shenzhen
Customer Profile
This medical institution is a non-profit tertiary public general hospital in the region. It is the only tertiary public general hospital in the free trade zone and the first general public hospital in South China to win the JCI reaccreditation Gold Award. Integrating medical treatment, teaching, research, prevention, rehabilitation and health management, it builds an international medical service benchmark. It delivers high-quality medical services for residents in the zone and overseas patients, and strives to develop into an international medical service platform for the Guangdong-Hong Kong-Macao Greater Bay Area.
Project Background: Why Is It Hard to Manage a Hospital’s IT Assets?
The hospital’s IT environment consists of Huawei servers and storage, Sangfor SCP virtualization platform, Windows and Linux operating systems, MySQL and SQL Server databases, Nginx middleware, plus a network layer built with Huawei switches.
This setup is typical. Hospital IT departments commonly face this dilemma: business systems are numerous and mission-critical, while the IT team remains lean. Core services including HIS (Hospital Information System), EMR (Electronic Medical Record), LIS and PACS must run 7×24 hours. Any lag in registration, billing or clinic queuing is immediately noticed by frontline clinical staff. Yet the IT resources supporting these services come from multiple vendors and tech stacks, forming a large and diverse inventory of devices.
The biggest challenge for such teams is not the inability to operate a certain type of device, but the fragmented management of heterogeneous resources. Each category of equipment has its own management portal and viewing method, forcing O&M staff to log into devices one by one for inspection. This is the root cause behind all pain points in this case.
Project Pain Points: Five Pain Points, One Underlying Root Cause
Pain Point 1 No unified monitoring platform leads to passive and inefficient O&M. Full-stack resources rely on manual device-by-device login inspection with no centralized automated monitoring. This is the core issue: resources are managed in silos, and engineers have to chase individual devices.
Pain Point 2 Blind spots in resource status make it hard to predict risks. Key metrics such as Huawei switch link quality, storage controller status, Nginx service processes and server resource load are not collected or stored in real time. Without data, latent hardware faults and performance bottlenecks cannot be identified in advance, making unexpected business outages only a matter of time.
Pain Point 3 Faults are discovered after impact occurs, slowing troubleshooting. Without historical runtime data, O&M engineers lack reference benchmarks once failures happen. They can only carry out blind checks across devices and links, leading to lengthy fault localization and unpredictable business recovery time.
Pain Point 4 O&M lacks data support, resulting in subjective decision-making. Without metric collection, log retention or historical data, statistics on device load, resource utilization, failure frequency and system availability are unavailable. Decisions such as storage expansion or server renewal rely purely on experience.
Pain Point 5 Inefficient report management prevents data value release. Records are kept on paper or scattered Excel files, bringing difficulties in statistics, inconsistent formats and divergent statistical standards. Data mismatches often occur in cross-department collaboration, and management cannot obtain system operation status promptly.
Upon review, these are not five isolated issues, but different manifestations of the same root cause: without a unified monitoring platform, O&M work can only stay reactive.
Lerwee Monitoring Solution
Centralized Management of Full-Stack Resources — Solve the Problem of Multi-Vendor Mixed Deployment
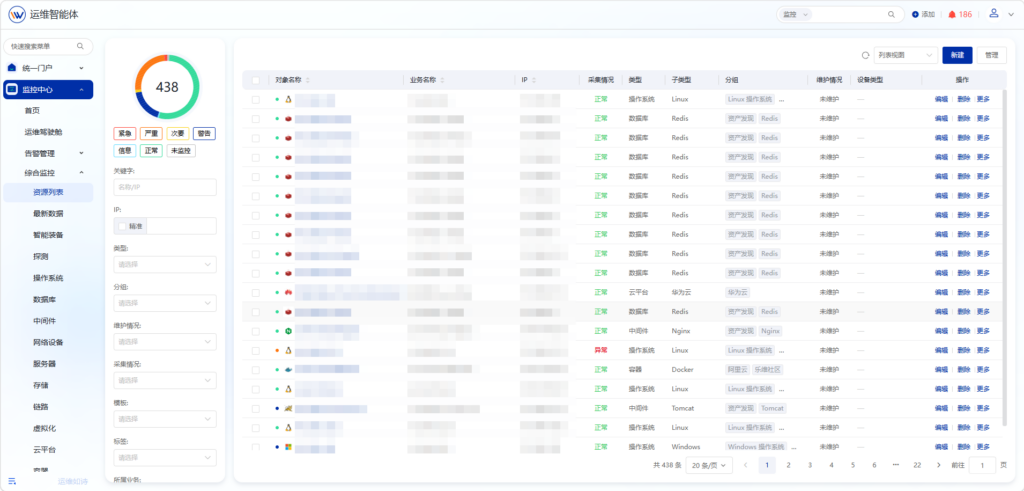
All servers, storage, network devices, virtualization platforms, operating systems, databases and middleware across the hospital premises are onboarded to one single platform, ending the siloed management of heterogeneous resources.
This is the foundation of the project and also its most technically demanding part. To manage heterogeneous resources including Huawei, Sangfor, Windows, Linux, MySQL, SQL Server and Nginx on one platform, the monitoring system must feature broad collection and adaptation capabilities.
This is embedded in the underlying design of Lerwee Monitoring. Its Perseus Collector Manager supports multi-server and multi-proxy architecture. It is compatible with dozens of protocols including SNMP, SNMP Trap, Agent, SSH, Telnet, WMI, ODBC, JMX, IPMI, SMI-S, Redfish, HTTP and Syslog. Powered by automatic identification technology, it recognizes device type, vendor and model, covering over 500 vendors, more than 8,000 device models and 100,000+ metric items.
For the customer, this eliminates the need to purchase separate management tools or log into independent consoles for each device type. All resources can be managed centrally after being connected to this unified platform.
Real-Time Collection & Visualization of Core Metrics — Eliminate Resource Blind Spots
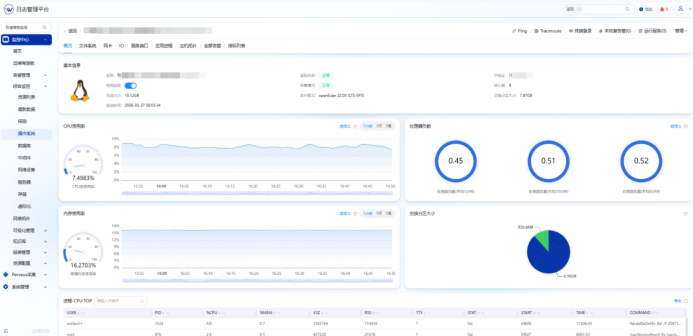
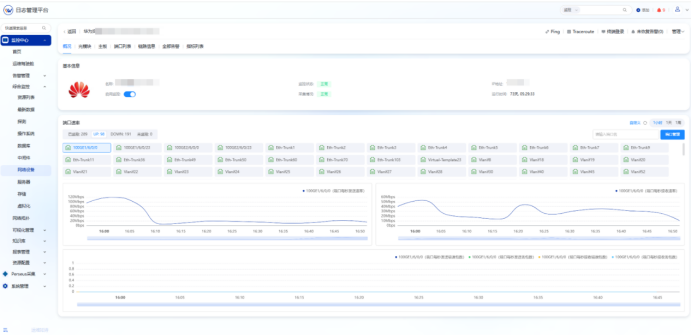
Key metrics such as CPU, memory, disk, port traffic, link status, service processes and database connections are collected to deliver intuitive display and trend analysis covering underlying hardware up to upper-layer applications.
A notable detail lies in the collection scope: switch link quality, storage controller status and Nginx service processes. These middle-layer indicators are frequently overlooked. Poor link quality, abnormal storage controllers and silently exited processes usually do not trigger hardware-level alerts, yet they are common triggers of business slowdowns.
By collecting these metrics in real time and retaining historical data, the O&M team gains the ability to spot hidden risks in advance. The accumulated data also supports subsequent trend analysis and capacity planning.
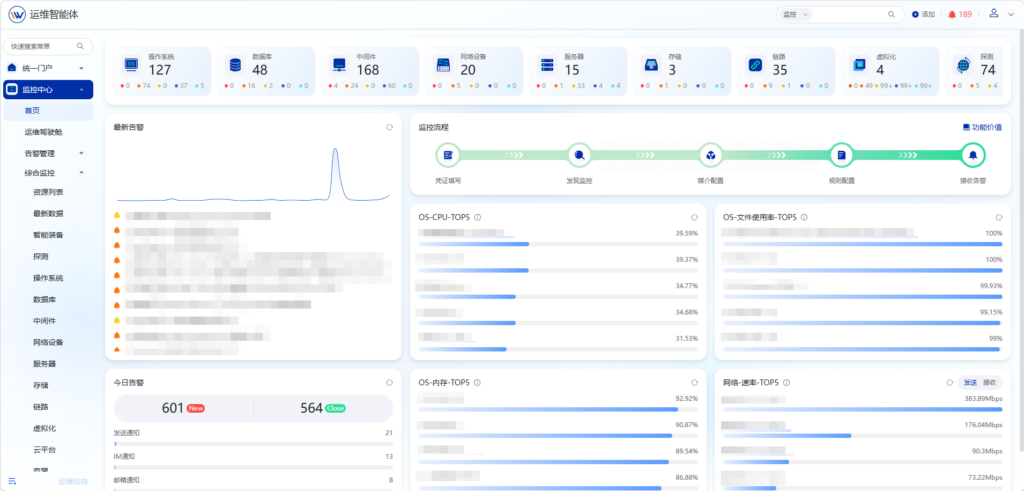
Centralized Visual Dashboard — Shift from Device-by-Device Login to Global Overview
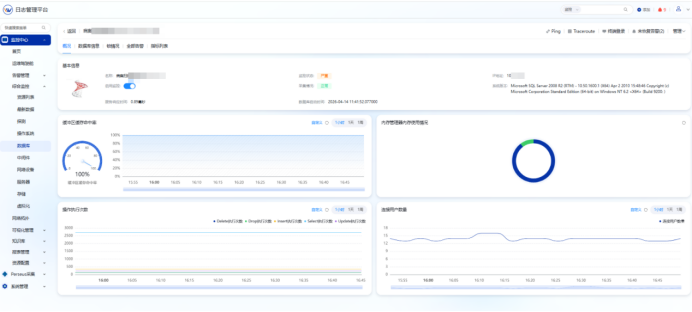
The monitoring homepage displays core operational metrics of all devices at a glance. Engineers no longer need to log into individual machines and can quickly grasp the overall status of IT resources.
This capability reshapes daily O&M workflows. Previously, inspections required staff to hunt for problems by accessing each device. Now problems surface automatically on the dashboard. It converts collected data into daily efficiency gains for frontline O&M teams.
Automated Digital Report Generation — Translate Data into Management Insights
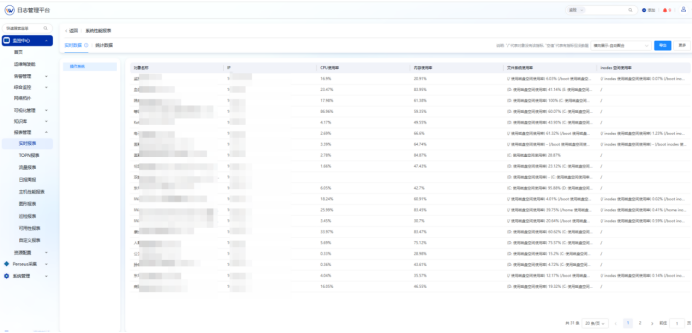
Replacing traditional paper and Excel records, the platform automatically generates performance reports for core systems such as operating systems and databases with unified statistical standards and formats. Reports can be saved automatically, analyzed from multiple dimensions and managed centrally.
The built-in report library of Lerwee Monitoring covers real-time reports, availability reports, TOPN reports, inspection reports, traffic reports, daily/weekly summaries and host performance reports. It supports custom time ranges, export and sharing.
Three core benefits are delivered for this customer: automating manual statistics to free up O&M manpower; unifying standards for consistent cross-department communication; and archiving periodic reports to provide traceable quantitative evidence for expansion and upgrade decisions.
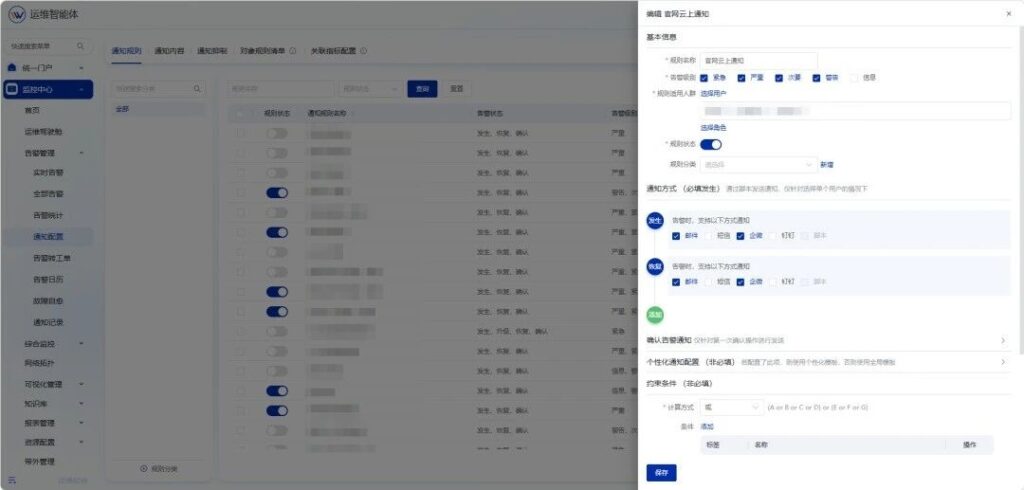
Enterprise WeChat Bot for Instant Alert Delivery — Push Alerts Directly to Responsible Staff
Integrated with Enterprise WeChat Bot Webhook, the system automatically sends alert messages including alert type, title, affected host, host IP and timestamp to designated group chats once faults occur, ensuring O&M engineers receive notifications and start handling issues promptly.
Faults no longer rely on user complaint calls for detection. Lerwee Monitoring supports multiple notification channels including SMS, email, WeChat, DingTalk and group bots, paired with alert acknowledgement and escalation mechanisms to prevent unattended alerts.
Enterprise WeChat Bot was chosen for practicality: the hospital IT team already uses Enterprise WeChat for daily collaboration. Alerts fit naturally into existing workflows with nearly zero learning cost. Messages carry host, IP, time and type information, so frontline engineers can start troubleshooting immediately.
Business Outcomes: Value for Different Stakeholders
For frontline O&M engineers
Daily work changes from repetitive device-by-device inspection to global overview on the dashboard. Instead of learning about failures from user calls, they receive alerts first via Enterprise WeChat. The same team achieves dramatic improvements in response speed and coverage.
For IT department heads and management
Automated standardized performance reports remove manual data collation for internal reporting and cross-department cooperation. Historical records of device load and utilization enable expansion and upgrade decisions backed by reports rather than guesswork.
For hospital business teams
Core business systems are protected by a persistent monitoring mesh. Previously invisible risks such as hardware hidden troubles, performance bottlenecks and process anomalies can now be detected early and located quickly, substantially strengthening business continuity.
An often-overlooked advantage: Architecture benefit. The project required no modifications to business systems. Only a unified monitoring plane was deployed on top of resource layers. It features focused investment, low intrusion and fast returns. For hospital IT teams constrained by limited budget and manpower, this represents a high-leverage, low-investment O&M upgrade path.
This case provides a standardized implementation template for small and medium-sized IT teams:
- Build a single entry point: onboard all heterogeneous resources to one monitoring platform to solve visibility gaps.
- Collect core metrics: focus on easily ignored middle-layer indicators including links, storage controllers and service processes to achieve granular observability.
- Enable data circulation: dashboards support daily O&M, automated reports serve management and planning, and WeChat bots handle emergency response for separate scenarios.
From the full product landscape of Lerwee Monitoring, unified monitoring is only the first step within the perception layer. This project focuses on solid implementation of monitoring and perception, with advanced capabilities reserved for future iteration. Still, for most hospitals and enterprises troubled by multi-vendor assets and manual inspections, a well-implemented unified monitoring system is often the most cost-effective starting point for O&M transformation.
- Case: Intelligent O&M Platform Build in Major Securities Firm
- Case Study | IT Defense for Tertiary A Hospitals: Stable Medical Services Guaranteed
- Case Insight | O&M Monitoring Platform Construction in a Large Biopharmaceutical Enterprise
- Practice of Building Intelligent Operation and Maintenance Platform for International Securities Enterprises
- Case Study: IT O&M Platform for a Listed Special Materials High-Tech Firm
- O&M Practice | Lerwee Monitoring Helps Stable Operation of Medical Business
 Chinese (China)
 Chinese (Hong Kong)