


Case Study: Unified O&M Platform Practice for a National Comprehensive Research Institute
Customer Profile
This institute is one of China’s key scientific research institutions. It focuses on two major areas: electronic information systems and intelligent equipment. Serving as the information support unit for the shipbuilding industry and the lead organization of the intelligent manufacturing innovation center, it boasts capabilities in large-scale information system integration, digital workshop construction, and smart institute development. The institute manages a large campus and extensive scientific research assets, with a complex O&M system covering IT, power supply, and scientific research equipment. There was an urgent need to build a fully offline, fully domestically adapted unified monitoring and O&M platform.
Customer Pain Points
The institute previously relied on general monitoring tools for O&M. These tools failed to meet the operational requirements of embedded devices, domestic operating systems, and scientific research scenarios, exposing common deficiencies in monitoring coverage, collection overhead, asset management, alarm handling, visualization, and intelligent capabilities.
01 Blind Spots in Monitoring for Domestic Embedded Operating Systems, No Unified Monitoring Means
Domestic embedded distributions based on the Linux kernel such as JARI-Works could not be fully managed by legacy tools, with specific issues as follows:
- Incomplete collection of core runtime metrics including CPU, memory, disk and process metrics on domestic processor platforms such as Loongson and Phytium;
- Lack of officially adapted collection plugins for Kylin V10 and OpenEuler;
- Specialized equipment such as display consoles and NPUs feature heavily customized, stripped-down systems, so general collection methods cannot be directly applied;
- Insufficient domestic compatibility certification documents, making it hard to satisfy internal audit and industry regulatory requirements for independent and controllable acceptance.
02 Resource Constraints: Conflicts Between Devices and Monitoring Collection Overhead
Embedded devices generally have low hardware specifications. In the production environment, general Agent installers often reach hundreds of megabytes, making installation impractical on devices with a 2-core CPU and 512MB memory. Even if installed, resident collection processes continuously consume CPU and memory, competing for resources with business workloads. When device load peaks, collection processes may further congest the system and even trigger business anomalies. In the event of network outages, collected data cannot be retransmitted, resulting in gaps in monitoring curves.
03 Decentralized Software and Hardware Asset Ledgers, Lacking Automatic Collection and Unified Views
Asset management relied on manual entry and scattered ledgers, leading to inaccurate and outdated information. Hardware information including CPU model, mainboard serial number, memory capacity and peripheral inventory, as well as software information such as kernel version, drivers, firmware and critical application lists, could not be automatically collected. There was no cabinet view for data centers or full-lifecycle audit for assets, and asset changes were not logged. Asset data scattered across disparate systems could not serve as a unified, reliable data source for monitoring, alarming and automated O&M.
04 Incomplete Alarm System, Manual Emergency Response and Limited Notification Channels
Legacy monitoring tools failed to form a standardized closed-loop alarm workflow. Alarms were scattered across different interfaces, lacking unified display and filtering by status, severity, business domain, IP and other dimensions. Notification channels were limited. The project required alarms to be pushed to the customer’s intranet system via local logs, custom scripts and standard APIs, which legacy tools could not support. Alarms continued to trigger during equipment maintenance, with no maintenance mode or suppression mechanism, causing substantial noise. In addition, alarm log fields were incomplete, hindering the reconstruction of alarm time, target, severity and recovery status during post-incident review and audits.
05 Insufficient Intelligent Analysis and Automated O&M Capabilities, Constrained by Fully Offline Deployment
Alarm correlation, anomaly diagnosis and root-cause inference relied heavily on manual experience, leading to long fault localization cycles. Built-in agent analysis logic was non-customizable, lacking secondary development interfaces and supporting documentation for customers to extend analysis rules according to their business requirements. O&M operations lacked out-of-band management (IPMI) capabilities; power-on, power-off and restart operations for physical servers required on-site access to the data center. Workflow orchestration lacked scheduled triggers, so periodic O&M tasks could not run automatically. Meanwhile, the platform had to run in a closed, fully offline intranet environment, with the large AI model deployed separately by the customer. This imposed extra requirements on the platform’s architecture decoupling.
Lerwee Solution
To address these challenges, Lerwee adopted a distributed architecture of lightweight Agent + centralized Web console. We delivered standardized management and customized development covering eight modules: unified monitoring, asset management, alarm notification, visualization, knowledge base, intelligent analysis, automated O&M and O&M dashboard. The final deliverable is an integrated monitoring and O&M platform that runs independently on the intranet and supports domestic software and hardware.
1 Lightweight Data Collection
The collection layer is specially optimized for resource-constrained embedded devices:
- Multiple collection modes: Agent (primary), SSH, HTTP, script and computational collection, flexibly selected by device type;
- Ultra-lightweight design: The Agent installer is only 35MB. On a typical 2-core 512MB embedded device, CPU usage is approximately 0.6% and memory usage approximately 0.8%, with negligible impact on business workloads;
- Fuse protection: When device CPU exceeds 90% or available memory drops below 10%, the Agent automatically pauses non-critical collection tasks and resumes after resource recovery, preventing resource contention between monitoring and business;
- Data retransmission: Collected data is cached locally and automatically retransmitted once the network recovers, eliminating gaps in monitoring curves;
- Dedicated installers: Three Agent packages for general Linux, display console devices and ARM-based Docker environments to adapt to different device form factors;
- One-click discovery: Bulk scanning by IP segment and management credentials, automatic identification of vendor and operating system with matching monitoring templates. Scans support termination, re-scanning, credential validation and vendor switching.
2 Full-Stack Monitoring
Designed for the institute’s embedded terminals and infrastructure, the platform supports full-category management and adaptation covering operating systems, hardware, networks, cloud platforms, databases, middleware, containers, storage, links and power supply equipment.
Monitoring Scope:
- Operating systems and embedded terminals: JARI-Works V4/V5, Kylin V10 SP3, OpenEuler and Windows. NPU monitoring is included for Kylin and OpenEuler, targeting resource-limited embedded devices such as display consoles and NPUs;
- Server hardware: Phytium, Kunpeng, Ascend, ruggedized servers, compatible with BMC management systems from IBM, Lenovo, Hillstone, Inspur, Sugon, FiberHome, ZTE, Dell, HP and other vendors;
- Network devices: Switches from Huawei, Deepsec, SiEngine and other brands;
- Cloud platforms and virtualization: FusionCube virtualization, with pre-built templates for Huawei FusionCompute, Sangfor HCI, Inspur InCloud, H3C UIS/CAS, VMware, SmartX and ZStack;
- Databases: Huawei GaussDB, Dameng DM8, KingbaseES, TDSQL, MySQL, Oracle, SQL Server, PostgreSQL, etc.;
- Middleware and containers: Display console middleware (JMX), K8s and Docker container platforms;
- Storage and power supply: Huawei OceanStor storage devices, PDU power supply units, network and dedicated line links and other IoT objects.
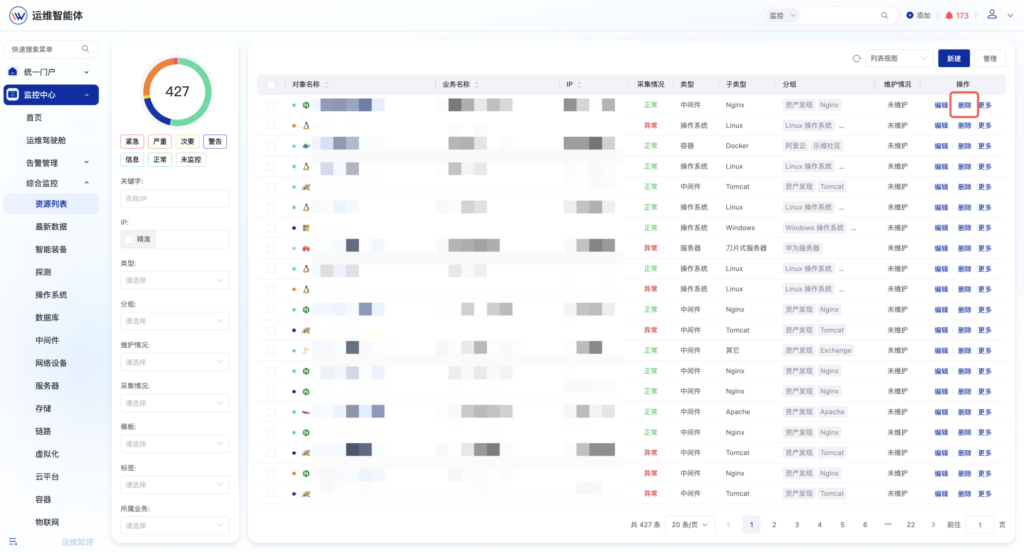
To date, the platform has stably managed more than 200 devices of all the above types within the institute’s intranet, with reliable collection, monitoring, alarm and asset functions.
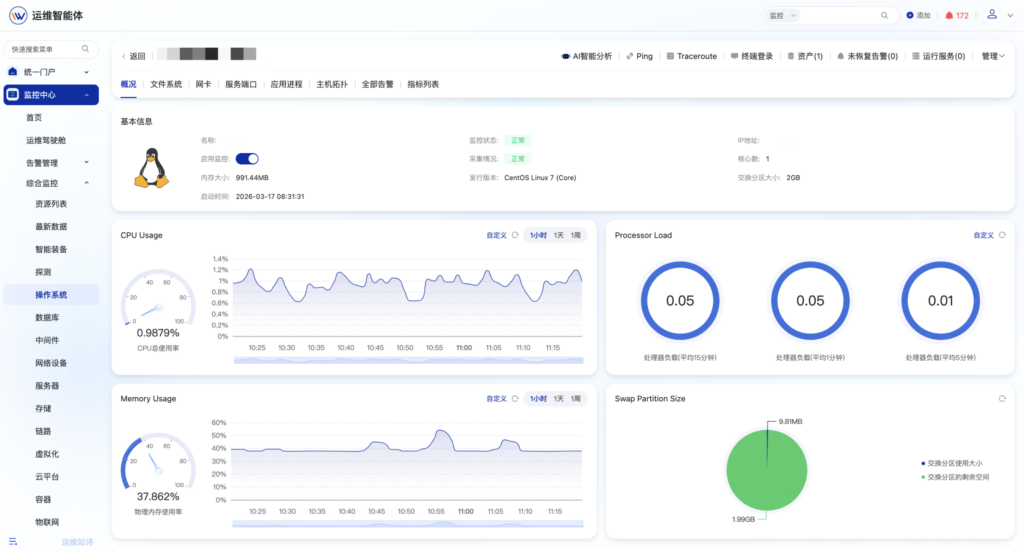
Example: Operating System Status Monitoring and Analysis
For domestic embedded and general-purpose operating systems, the platform delivers comprehensive monitoring of core runtime metrics, all configurable with threshold-based alarms.
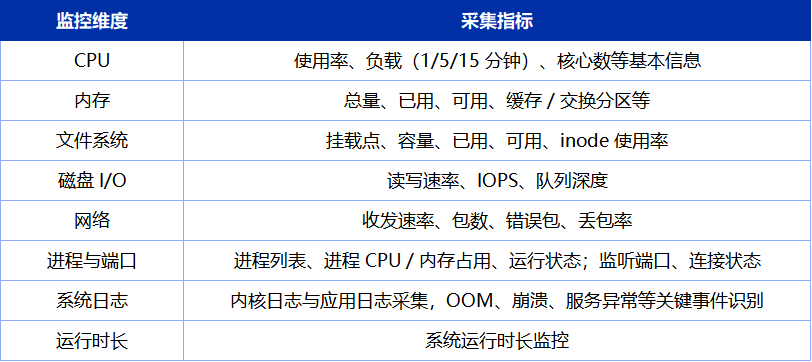
Core Operating System Metric System
- Covers JARI-Works V4/V5, Kylin V10 SP3 (with NPU monitoring), OpenEuler (with NPU monitoring) and Windows;
- Log monitoring: Log paths, keywords and alarm severity can be configured via Manage → Add Log Metric in the OS metric list;
- Availability probing: WEB probing (GET/POST with status code and response time validation), TCP probing, PING/UDP probing;
- Link monitoring: Built-in Cisco SLA, Huawei/H3C NQA and ICMP probing. Customizable bandwidth, uplink/downlink thresholds and alarm levels for real-time statistics on latency, jitter and packet loss. After monitoring deployment, dedicated monitoring templates can be applied to special equipment such as display consoles and NPUs for precise metric matching.
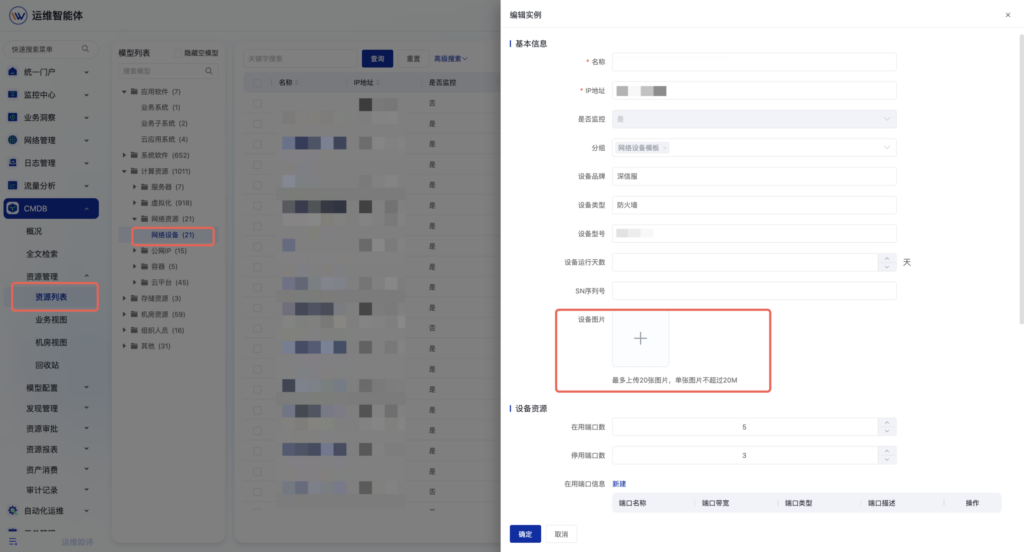
Automated Software and Hardware Asset Management: Auto Collection, Flexible Modeling, Full Audit
Lerwee CMDB serves as the single source of asset data across the platform, enabling automatic asset collection, flexible modeling and full-lifecycle audit to control assets from entry through change.
- Automatic collection: Hardware metrics including CPU model, mainboard serial number, memory capacity and peripheral inventory; software metrics including kernel version, drivers, firmware and critical application lists;
- Flexible modeling: Custom CI attributes supporting six data types: string, integer, IP, enum, boolean and date. Asset models, fields and relationships can be configured on demand;
- Bulk import and visualization: Bulk import of historical asset data. Data center cabinet view for intuitive physical asset management;
- Full audit: All asset operations are logged, including user, target, operation details, type and timestamp, satisfying compliance traceability requirements.
Alarm and Notification System: End-to-End Closed Loop from Generation to Resolution
The alarm workflow covers alarm generation, filtering, correlation, notification and handling to form a full closed loop.
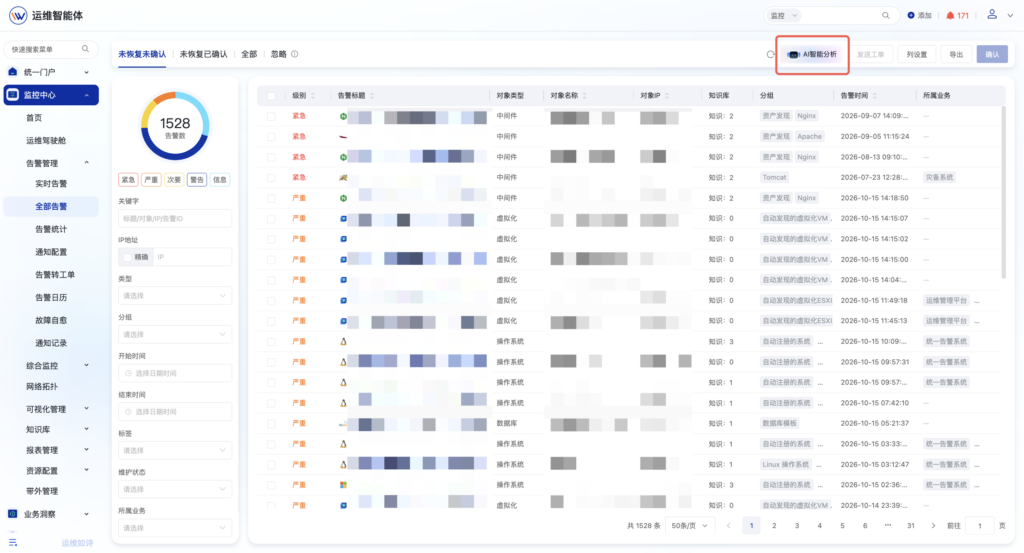
- Closed-loop alarm management: Real-time alarms displayed on a timeline, filterable by severity, keyword, IP, type, group, time, tag, maintenance status and business domain. Alarms are categorized as unacknowledged unresolved, acknowledged unresolved, all alarms and suppressed alarms. Bulk acknowledgement, closure and export are supported. Alarms can be linked to knowledge base articles, monitoring metrics and threshold rules for one-click reference during resolution. Alarm logs fully record timestamp, target, severity and recovery status for review and audit.
- Notification delivery: Custom notification rules. Push channels include local log recording, custom script triggering and standard API push to the customer’s intranet system. Scripts can drive GPIO buzzers or LEDs for on-site audible and visual alarms.
- Noise reduction and maintenance: Alarm suppression and maintenance mode reduce noise during maintenance windows. Temporary maintenance windows range from 1 to 1440 minutes. Recurring maintenance windows support one-time, daily, weekly and monthly schedules, with automatic alarm suppression during the window.
- AI alarm analysis: Trend analysis, severity distribution and overall assessment for alarms from the past 30 days, with automatically generated reports and optimization recommendations.
Automated O&M and Out-of-Band Management: Secure Out-of-Band Operations, Flexible Workflow Orchestration
A dedicated Out-of-Band Management menu is added to the automation module, providing out-of-band capabilities for physical servers supporting IPMI/BMC, alongside enhanced workflow orchestration and scenario-based job capabilities.
- Out-of-band management: Operations include power-on, graceful shutdown, forced shutdown, restart and status query. Bulk operations based on CMDB assets are supported. Pre-operation checks verify online status and maintenance windows. Operation results are written back to event streams to trigger subsequent automated actions.
- Full audit: Logs capture operator, timestamp, target, original state, new state, operation type, reason and result. Audit logs are partitioned monthly and non-deletable.
- Security policies: BMC credentials are encrypted and stored in a secure vault. The same asset cannot receive multiple shutdown commands within 5 minutes. The global concurrent IPMI task limit is 50. Forced shutdown is restricted to senior O&M administrators, requiring secondary confirmation and a mandatory reason entry.
- Workflow orchestration: Scheduled triggers are added alongside manual, event and alarm triggers. Supports Cron expressions, start/end times, execution intervals (minute/hour/day/week/month), time zones and activation status, with rule toggling and execution history query. Scheduling uses Quartz persistent clustering with a 30-second scan cycle for pending tasks. Database locks implement leader election to guarantee single-point triggering. Triggered tasks run asynchronously on Kafka to avoid scheduler thread blocking.
- Scenario capabilities: Inspection management, job management and configuration management are delivered together, covering configuration update, distribution, backup and system inspection.
Built-in Agent + Open Interfaces + Conversational AI Assistant
The built-in intelligent analysis agent adopts a four-layer architecture: data access layer, analysis engine layer, rule management layer and interface layer. Core components include data collection, alarm correlation, anomaly diagnosis, root-cause inference, rule engine, model management and API gateway, supporting alarm correlation analysis, anomaly diagnosis and root-cause inference.
- Secondary development and continuous iteration: Five types of secondary development APIs are exposed for data analysis, alarm correlation, anomaly diagnosis, root-cause inference and custom rules. Accessible via RESTful API, Python/Java SDK and plugin mechanisms. Analysis logic can be modified or replaced by the customer, with a delivered Intelligent Agent Secondary Development Guide for long-term capability evolution.
- Independence and architecture decoupling: The platform does not embed a large AI model; the model is deployed separately by the customer. The platform only provides data output interfaces and the agent runtime framework to satisfy independent controllability requirements.
- AI analysis: An AI analysis entry is embedded on alarm detail and alarm list pages. Natural language dialogue supports root-cause analysis, similar alarm retrieval, resolution suggestions and knowledge recommendation. Results are displayed in a sidebar. Accepted recommendations can generate tickets directly, closing the loop from analysis to resolution.
Visualization and O&M Dashboard
The platform provides drag-and-drop configurable panels with line charts, gauges, donut charts, tables and text widgets, each with independent data source configuration. The highlight is a ship-themed O&M dashboard for duty monitoring and leadership briefings, delivering a single-pane view of overall network health.
- Ship main visual: The hull, mast and cabins divided by business domains form the core view. PixiJS particle effects flow from bow to stern; particle color changes according to link health. Two hull modes are available: above-water and underwater.
- Cabin popups: Hover or click a cabin to view core metrics for the business domain, including business name, responsible person, online/offline device count, alarm distribution by severity and latest change timestamp, with a jump link to the business domain detail page.
- TOP10 module: Rankings for resource consumption (CPU/memory/disk), alarm frequency, ticket backlog and slow interfaces.
- Global metrics and cloud resource overview: Global indicators including online rate, alarm count and pending tickets are displayed at the top and bottom. Cloud resource overview is configurable.
- Configurability and performance: Core device status, hull markers, resource usage, alarm severity and cabin data sources are configurable. The control panel supports one-click inspection and emergency mode, with reserved interfaces for power and liquid supply equipment. The large screen adapts to 1920×1080 and 3840×2160 resolutions, supports fullscreen and carousel, renders within 3 seconds on first load, and supports 5-minute offline caching.
Customer Benefits
01 Independent and Controllable, Compliance Verified
Full adaptation to JARI-Works, Kylin, OpenEuler and Phytium, Kunpeng, Loongson platforms, closing monitoring gaps such as NPU monitoring. Core components run closed-loop on a domestic intranet with no external network or overseas component dependencies. The platform has passed information technology innovation compliance testing and third-party authoritative validation, meeting acceptance criteria for function, performance, security and reliability.
02 Lightweight Onboarding, Transparent to Business
The Agent is only 35MB, with approximately 0.6% CPU usage and 0.8% memory usage on 2-core 512MB devices. Automatic fuse protection yields resources during high load. Resource-limited devices such as display consoles and NPUs can be stably managed, solving the dilemma of “needing monitoring but unable to install it without impacting business”.
03 Unified Data, Closed-Loop Alarms, Improved Response Efficiency
CMDB provides automatic, trusted unified asset data to support monitoring, alarming, automation and dashboards. Alarms are centralized and linked to knowledge bases, metrics and threshold rules. Maintenance mode suppresses noise. AI generates trend analysis and optimization suggestions for 30-day alarm data.
04 Automation and Visualization Reducing Manual Workload
Out-of-band management unifies power-on, power-off, restart and status query for physical servers with bulk operations and secondary confirmation, cutting trips to the data center. Scheduled orchestration automates periodic tasks such as inspection and configuration backup. The ship-themed dashboard delivers a single-pane view of link health, business online rate, alarm distribution and TOP10 risks.
05 Customizable Intelligence for Long-Term Independent Evolution
The built-in agent supports alarm correlation, anomaly diagnosis and root-cause inference. Five categories of secondary development APIs, Python/Java SDKs, plugin mechanisms and documentation are provided. The large AI model is deployed independently by the customer. Full documentation and source code are delivered, enabling independent build, long-term O&M and secondary development for continuous self-evolution.
- Lerwee Integrated O&M Solution Empowers Double First-Class Universities
- Case Study: IT O&M Platform for a Listed Special Materials High-Tech Firm
- Case Study: Unified O&M Platform Practice for a National Comprehensive Research Institute
- Case Insight | O&M Monitoring Platform Construction in a Large Biopharmaceutical Enterprise
- Case: Intelligent O&M Platform Build in Major Securities Firm
- Case Study|Building Smart O&M System to Safeguard Core Clinical Services of Tertiary‑A Hospitals
 English
 Chinese (Hong Kong)