

Perseus Collection
Perseus is an open-source data collection platform that eliminates the cumbersome template configuration of traditional collection tools. It supports unified Agent management, automatic discovery of cloud platform resources, and one-click scanning and management of IP resources. It is compatible with third-party open-source platforms such as Zabbix and Prometheus, and enhances their data interaction capabilities.
- Perseus code repository on GitHub: https://github.com/Lerwee/Perseus
Core Features of Perseus
1. Automatic Asset Discovery
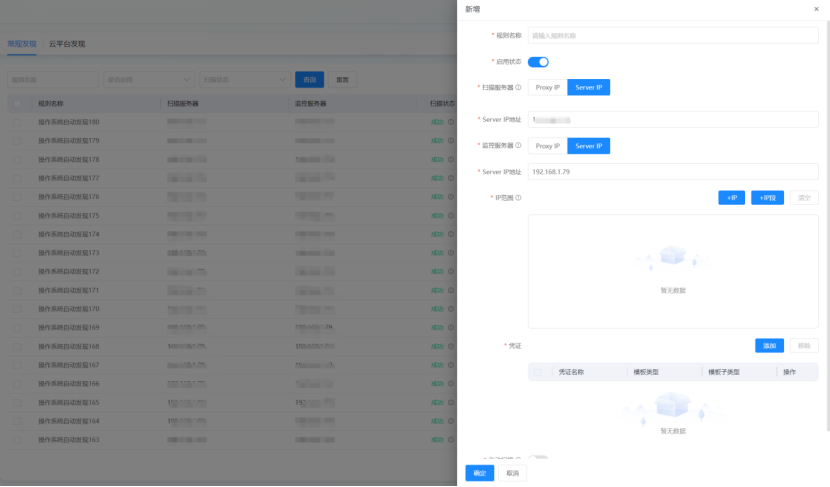
Typically, IT asset administrators struggle to keep track of a large number of IT devices, which requires effective asset discovery, identification, and management capabilities. Perseus’s automatic asset discovery efficiently addresses this challenge. Asset administrators only need to input IP segments and credentials to achieve one-click asset discovery (even cross-proxy discovery) and monitoring management, including but not limited to Linux servers, firewalls, switches, and routers.
Automatic asset discovery simplifies the monitoring and management process, reducing manual configuration work for asset administrators, improving asset management efficiency, and increasing the speed and accuracy of monitoring system onboarding.
2. Centralized Agent Management
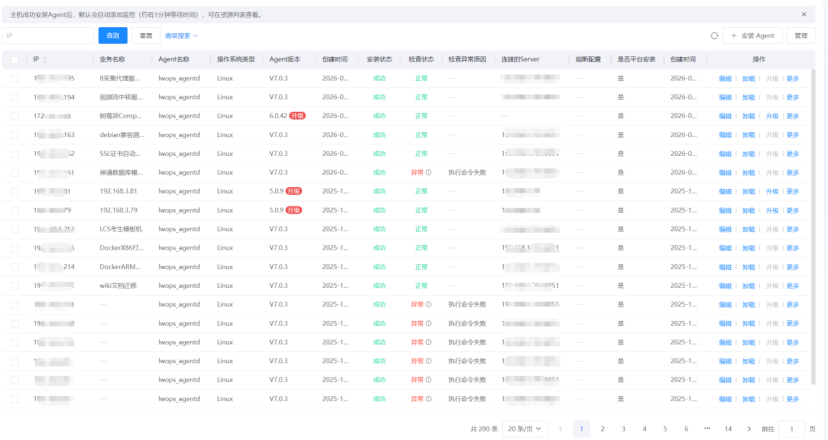
It supports Agent health checks, bulk import, bulk installation, manual installation, uninstallation, deletion, and circuit breaking (configuration, distribution, and recovery). It also enables automatic registration without the need for manual host addition.
3. Full-Stack Technology Management
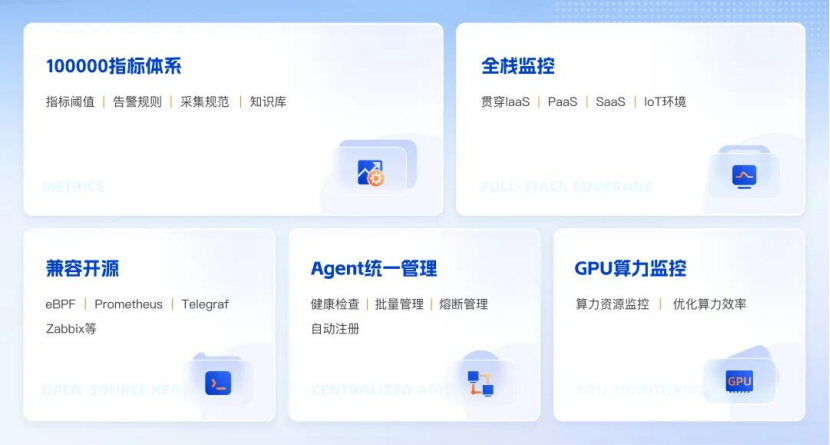
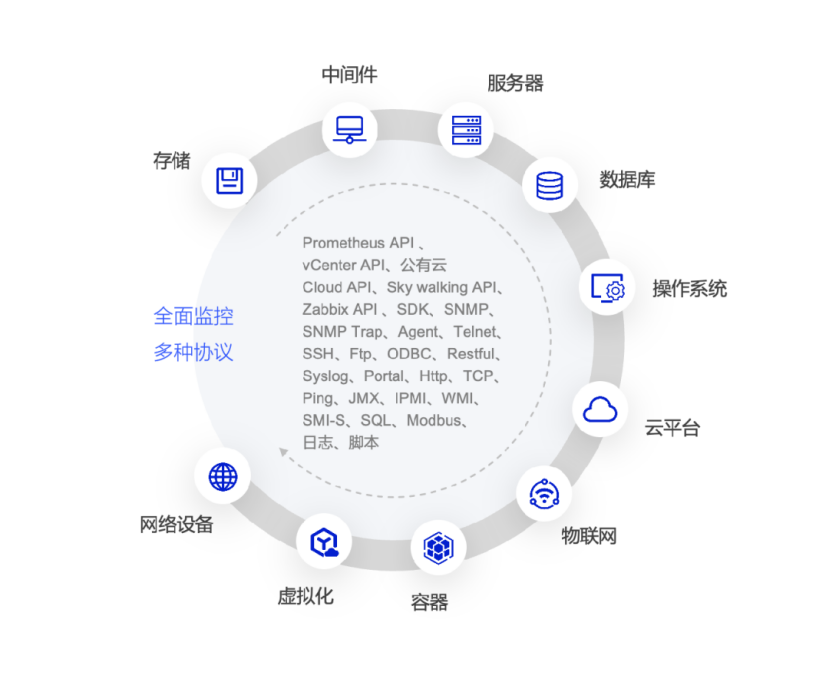
The Perseus collection platform is compatible with dozens of protocols and supports automatic adaptation via genetic technology. It meets the monitoring and collection needs of both domestic alternative and non-domestic alternative software and hardware, covering over 500 manufacturers and 8,000 device models, including traditional IT infrastructure, public clouds, private clouds, containers, and the Internet of Things .
4. End-to-End Business Chain Data Consumption
As the underlying core hub for data collection and management, the Perseus collection platform provides rich data interfaces for various upper-layer applications to consume data, including monitoring, network management, traffic analysis, CMDB, ITSM, as well as third-party logging, APM, observability, and AIOps algorithm platforms.
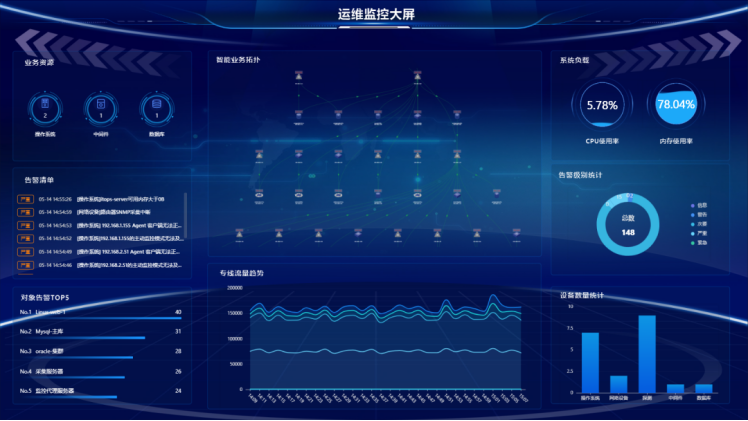
For example, by calling data generated (either self-collected or converted) by Perseus, the monitoring platform can generate rich visual charts.
5. Backward Compatibility
Perseus is not just a simple data collector. In addition to collecting data independently, it can connect to third-party data sources such as Prometheus, Cacti, Loki, Telegraf, OpenTelemetry, SkyWalking, and Zabbix. Since different data sources have inconsistent data structures and standards, Perseus also undertakes data conversion functions. Only standardized data can be used by upper-layer applications.
- Overwhelmed by a large number of monitored objects? With Lerwee Directory View, assets can be clearly categorized, easily managed, and quickly located.
- 功能上新 | 6月份乐维产品重点更新功能
- Lerwee NMS vs. Solarwinds NPM: Network Performance Monitoring (Part 1)
- 网络设备SNMPv3配置教程
- Release of LerweeAOM V8.0
- zabbix与乐维监控对比分析(三)——对象管理篇
 English
  Chinese (Hong Kong)