
Case Insight | O&M Monitoring Platform Construction in a Large Biopharmaceutical Enterprise
Project Overview
This case presents Lerwee’s project practice of building an intelligent O&M monitoring platform for a large biopharmaceutical client. Focusing on the development of full-stack intelligent monitoring, the project precisely addressed the client’s core pain points including incomplete monitoring coverage, rigid alerting, and inadequate visualization. Through full-stack resource management, the implementation of standardized O&M processes and the optimization of key indicators, we successfully built a monitoring system featuring full-stack visibility, intelligent early warning and rapid response, which has firmly established a solid IT defense line for the continuous operation of the client’s core businesses.
01 Client Profile
The client in this case is a large biopharmaceutical enterprise with a sophisticated core IT architecture that encompasses in-house business systems, financial and management systems, multiple types of databases (SQL Server, MySQL, etc.), network devices, servers, and virtualization platforms (VMware vCenter). As its business scales up and the volume of IT resources keeps growing, the enterprise’s legacy O&M monitoring system can no longer meet its development needs, creating an urgent demand for a more efficient and comprehensive intelligent monitoring platform.
02 Pain Point Analysis
Previously, the client adopted Zabbix, an open-source monitoring platform, which offers solid basic monitoring capabilities but has exposed a host of core pain points in supporting the O&M of complex IT architectures—these issues have severely hindered O&M efficiency and the ability to ensure business continuity:
- Incomplete and shallow monitoring coverage: Blind spots exist in the monitoring of critical components such as virtualization platforms and middleware; full-stack coverage from underlying hardware to upper-layer business cannot be achieved, making it impossible to fully reflect the health status of the IT architecture.
- Rigid alert mechanism and delayed response: Fixed thresholds without dynamic adjustment capabilities easily lead to a large number of false or missed alerts. The fault alert response process is unclear, with no defined responsible persons or processing time limits, resulting in delayed fault resolution.
- Weak visualization capabilities: The lack of an intuitive global view and visual fault location functions leads to fragmented data presentation. O&M staff struggle to quickly identify the root cause of faults, trapping IT O&M in a long-term predicament of passive fire-fighting.
- Insufficient scalability and adaptability: Poor compatibility with localized hardware and software fails to meet the requirements of indigenous innovation construction. In addition, function expansion relies on third-party systems, leading to high costs and long cycles for customized development.
Lerwee’s Solution
To address the client’s core pain points, the project adopted a three-tier full-stack architecture of “Collection-Monitoring-Application” and built a comprehensive, highly adaptable and scalable intelligent monitoring system. It delivers a one-stop platform for fault early warning and performance indicator management covering the entire spectrum from servers, operating systems, network devices and links to virtualization, middleware, databases and business availability. This platform fully meets the requirements of rapidly, effectively and comprehensively reflecting the health status of the current IT infrastructure and business systems, further reducing the risk of business downtime and ensuring the reliable, stable and efficient operation of all business support systems.
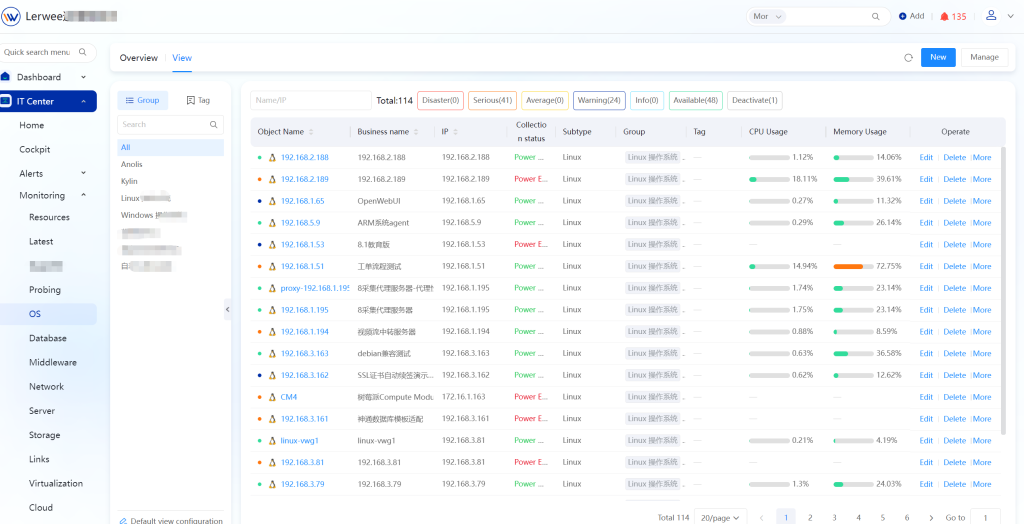
01 Full-Stack Monitoring
It centrally monitors and manages the status and performance of the client’s infrastructure resources (operating systems, databases, servers, virtualization platforms, network devices, middleware, etc.), ensuring a positive cycle of stable operation for business systems.
Operating Systems: Monitors CPU, memory, IO, file systems, network cards, ports, processes, system information and more. Specifically, for FTP services, the system can automatically trigger an alert when detecting the startup of an FTP service, meeting the user’s security and compliance requirements.
Middleware Monitors JVM uptime, system CPU load, open file descriptor count, connections accepted per second, etc. Database Monitors slow SQL statements, transactions, deadlocks, table spaces, ASM volumes, RAC, connection counts, data files and AlwaysOn information.
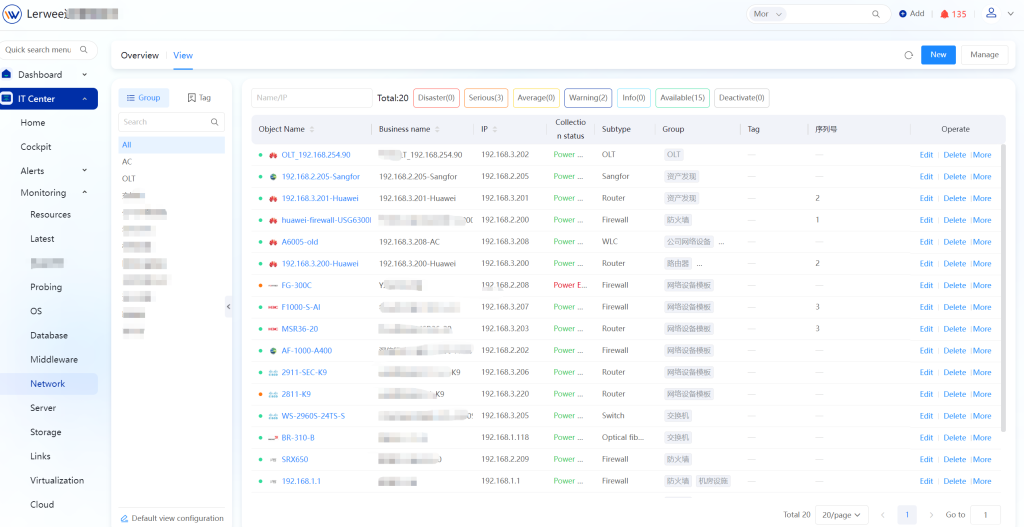
Network Devices Monitors power supplies, network interfaces, hard drives, fans, expansion buses, temperature, processors, memory, etc. Meanwhile, only uplink ports are monitored for access layer devices, and all ports for core devices; a critical-level alert will be triggered if bandwidth usage exceeds the preset threshold.
Servers
Monitors network interface information, LUN information, CPU information, general status, RAID information and hard drive information.
Network Links
Monitors port speed, port status, etc.
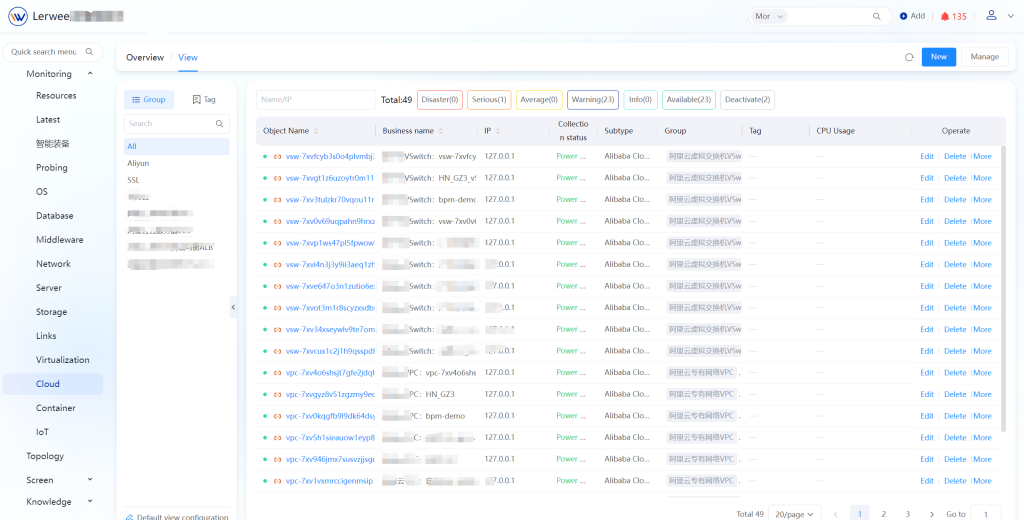
Virtualization
Monitors the structure, performance and status of virtualization platforms, physical hosts and virtual machines; for vSAN, it can track metrics such as its capacity and operational status.
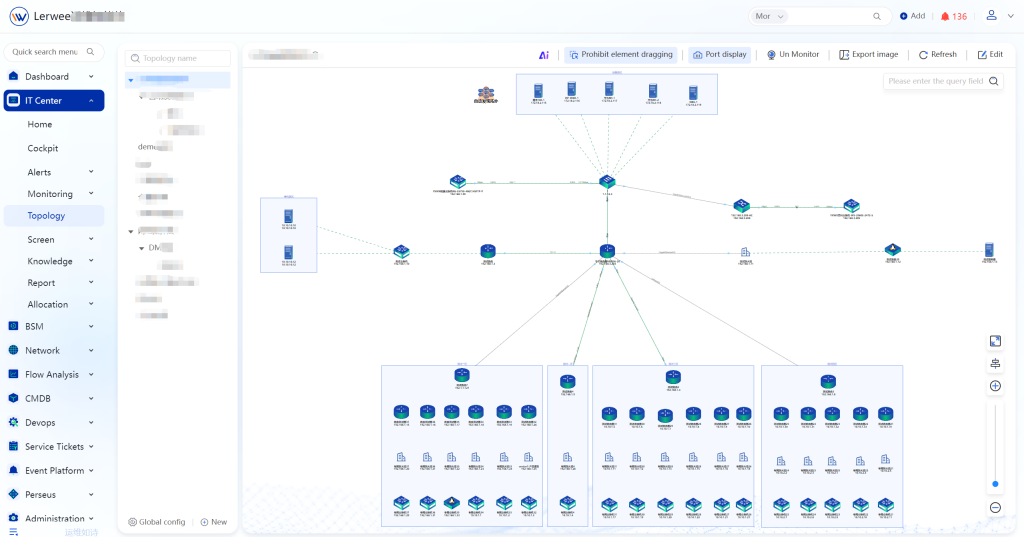
02 Network Topology
It automatically discovers the connection relationships among network devices, servers and storage, and generates topology diagrams, which enhances the visualization and monitoring capabilities of the network structure. The topology function supports permission management, formatted layout, node hiding, topology background, node icon replacement, sub-topology, legend, containers, SNMP configuration, stacked loop lines and other features.
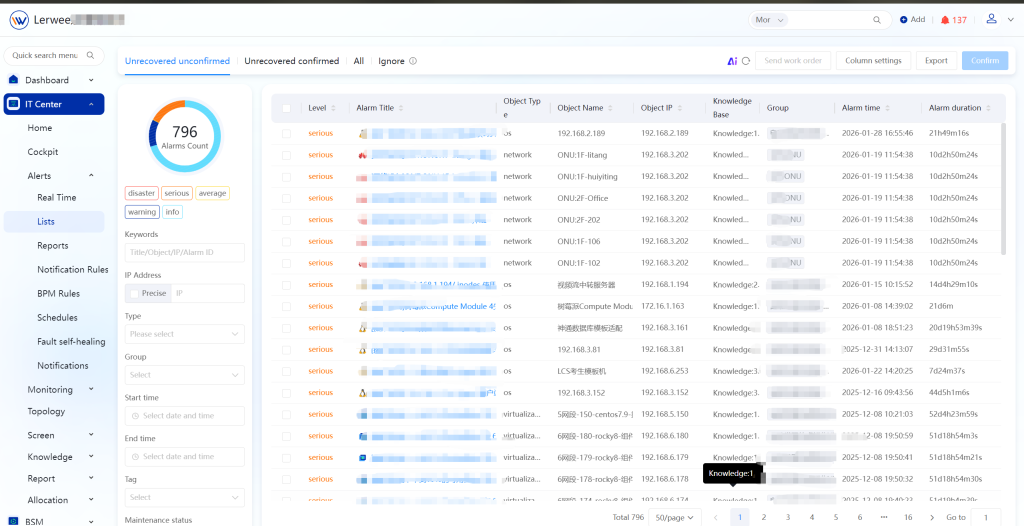
03 Centralized Alerting
It provides multiple alert notification methods, including SMS, email, phone calls, WeChat, DingTalk, group chats, and chatbots. The system supports an alert response mechanism and incident escalation mechanism to ensure no alerts are missed. It also enables alert filtering and distribution based on criteria such as alert severity, alert title, target object, IP address, group, type, and time period.
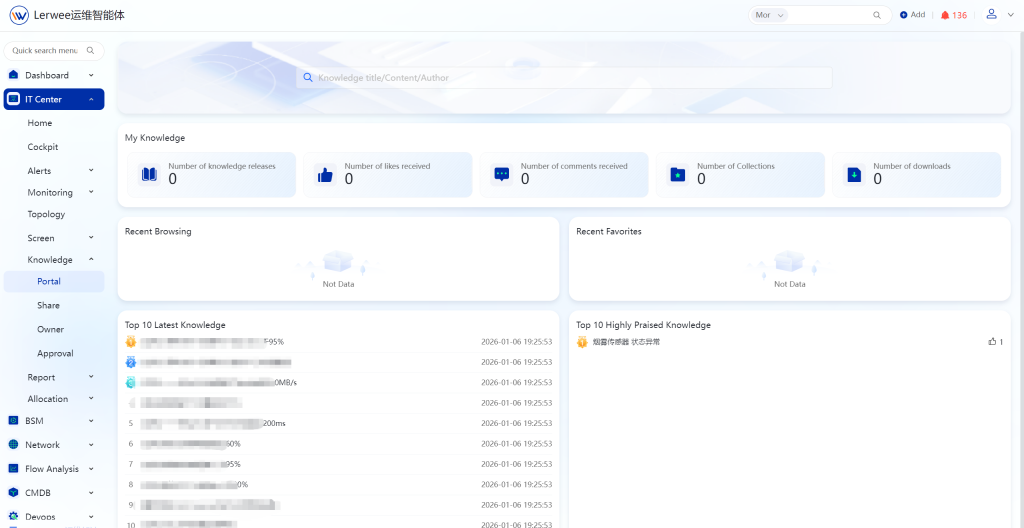
04 Knowledge Base
It features a built-in O&M Knowledge Base that enables the accumulation of O&M solution knowledge for alert handling across various resources (server performance, hardware health, log status, log keywords, process performance, database performance, etc.). The system automatically recommends historical similar scenarios and alerts, allowing the reuse of proven historical solutions for efficient issue resolution. As time progresses, the system continuously evolves to be more intelligent, delivering increasingly accurate decision-making recommendations.
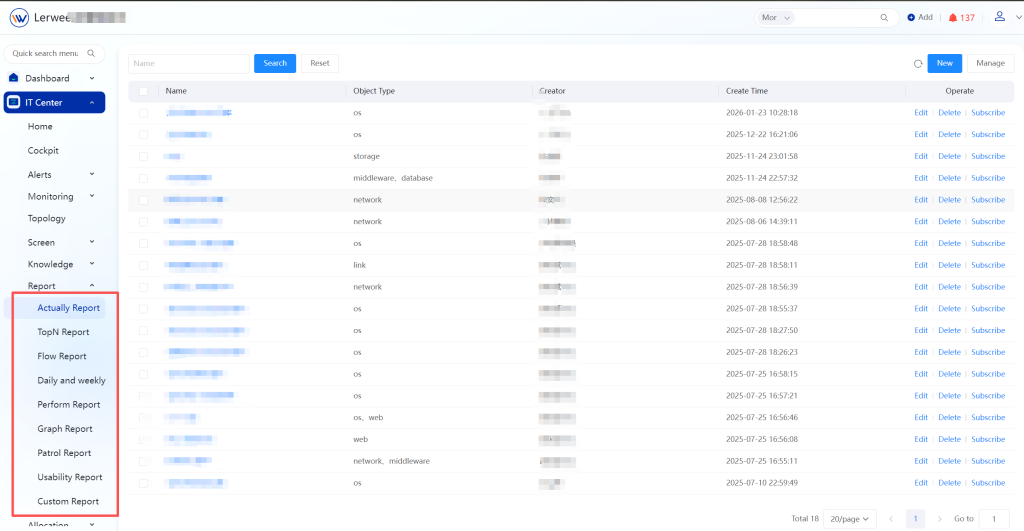
05 Diverse Reports
It offers a full range of diverse reports including real-time reports, TOPN reports, traffic reports, daily & weekly reports, zombie host reports, custom reports and graphical reports, to underpin O&M decision-making. The system supports independent subscription and proxy subscription with scheduled email delivery, and also enables report export, sharing and download. It allows custom time range queries to track data change trends.
Value and Benefits
The tangible outcomes of project implementation are directly translated into multi-dimensional value gains, providing core support for enterprise IT operations and business development. The specific value and benefits are as follows: it enables quantitative monitoring of business SLOs (Service Level Objectives) and automatically tracks abnormal nodes in transaction links through business topology diagrams, improving location efficiency by over 60%. The network topology diagram automatically flashes alert nodes; double-clicking on a node allows viewing of traffic data for associated links, reducing MTTR (Mean Time To Recovery) by 40%. Dynamic baseline technology reduces false positives by 50%, supporting multi-level alert push via WeChat/DingTalk and automated script-based remediation. The container/K8s monitoring module comes with built-in metric collection templates, cutting manual configuration efforts by 30%. Leveraging the LSTM (Long Short-Term Memory) algorithm to predict resource bottlenecks, the system triggers capacity expansion alerts three days in advance.
- Case Study: Monitoring & Network Management for a Listed Electronic Circuit Substrate Enterprise
- Case Analysis: O&M Platform Implementation for a Global Cultural & Creative Tech Leader
- Case Study | Lerwee Monitoring Helps a Large Cigarette Factory Build an Efficient O&M Monitoring System
- Case Study | Construction Practice of Basic Monitoring & Network Management Platform for a Listed Automotive Conglomerate
- Case Study: IT O&M Platform for a Listed Special Materials High-Tech Firm
- Construction Practice of Comprehensive Operation and Maintenance Platform for Futures Enterprises