

Bid Farewell to Fragmented Tools! Transform O&M from Constant Switching to One‑Stop Unified Management
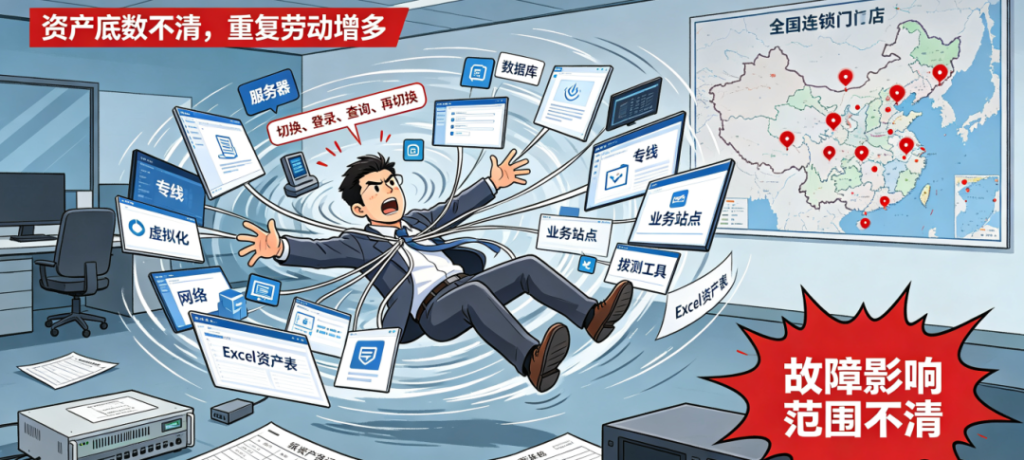
The most draining frustration in day‑to‑day O&M work stems from juggling numerous monitoring tools.
You log into one system to check server load, switch to a separate network management platform to troubleshoot switches, and launch yet another dedicated probing tool when business pages fail to load.
For nationwide chain stores and multi‑branch organizations, asset inventory relies entirely on manual Excel entry, and newly deployed devices are often overlooked.
When outages strike, O&M engineers toggle between dozens of windows to inspect devices one by one. Substantial time is spent just mapping outage impact scope, and any delay directly harms online business operations.
Infrastructure underpins stable enterprise services. Siloed management of servers, databases, networks, dedicated lines, virtualization, business sites and other resources leads to slow fault localization, unclear asset inventory, redundant labor and a host of other pain points.
Lerwee Monitoring delivers an integrated full‑domain infrastructure management solution, covering servers, operating systems, databases, middleware, network devices, links, probing capabilities, virtualization, IoT devices and more. Backed by real‑world industry deployment cases, it resolves fragmented O&M pain points in one unified platform.
Automatic Asset Discovery & Onboarding with Layered Asset Views
Group‑wide enterprises and chain organizations share identical O&M challenges: geographically dispersed devices, opaque asset status and outdated ledgers. Traditional manual entry is highly inefficient. It also brings awkward issues such as unclaimed hardware, undetected expired maintenance contracts, and missing contact persons for fault handling.
Lerwee Monitoring supports full‑segment bulk scanning. It automatically identifies all categories of IT hardware including servers, switches, firewalls, storage and virtual machines. New devices are onboarded automatically with zero manual entry.
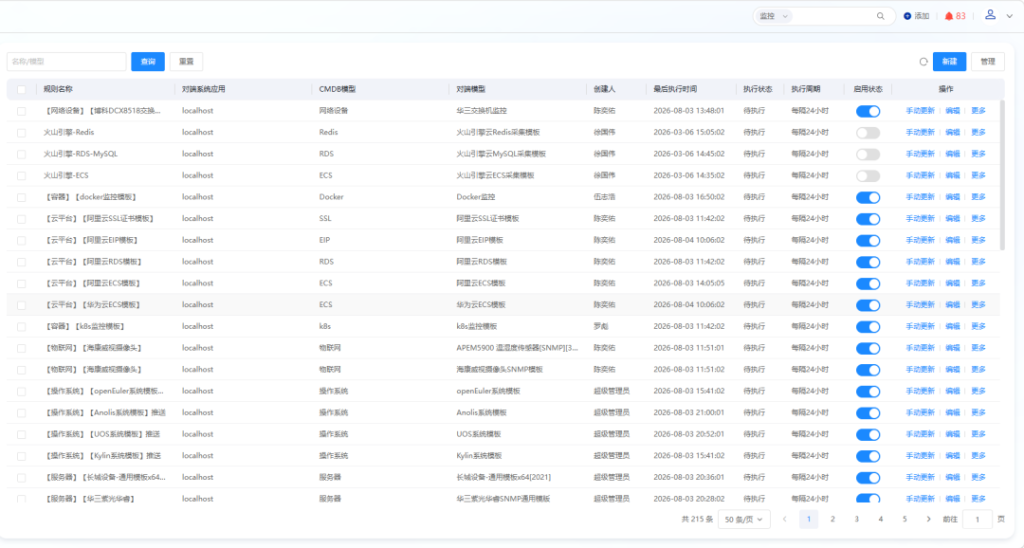
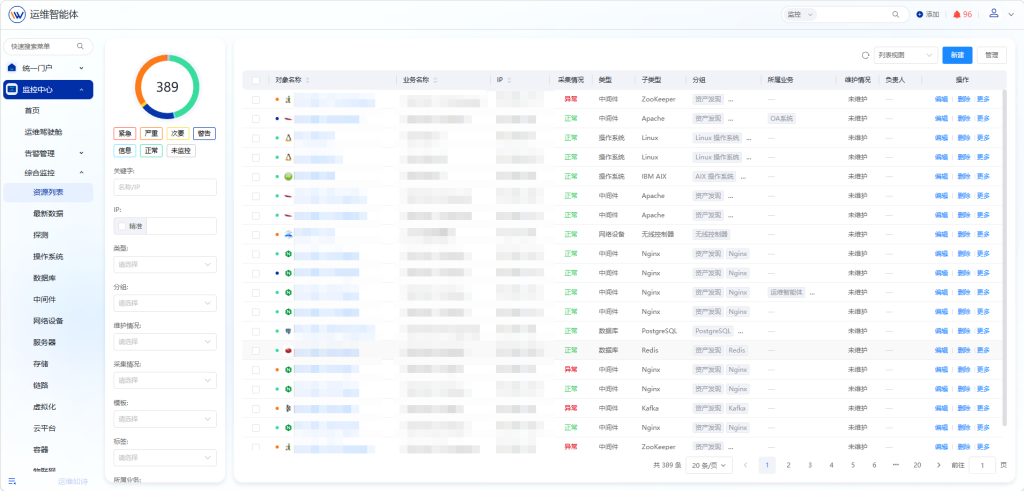
The platform supports customizable multi‑level tree‑style layered views. Assets can be grouped and managed across dimensions such as national regions, provincial‑municipal stores, computer rooms, business lines and projects. Headquarters gain a bird’s‑eye view of device status across all branches with one click. Custom asset attributes are available for inputting serial numbers, maintenance vendors, O&M contacts, expiration dates and other metadata. It serves as a lightweight alternative to heavy‑duty traditional CMDB, enabling refined asset management without extra system procurement.
For large‑scale device fleets, the platform offers maintenance mode, bulk threshold configuration and monitoring template cloning. Parameter adjustments for hundreds of devices take merely ten minutes, eliminating tedious per‑device manual configuration. All asset data auto‑syncs with reports, identifying long‑term low‑utilization and idle hardware to help enterprises unlock IT resources and cut hardware expenditure.
This capability has been fully implemented for a large chain medical‑checkup institution. Previously, hardware across dozens of provincial and municipal branches was scattered, with asset ledgers compiled manually by on‑site O&M staff. Headquarters would spend an entire day aggregating load statistics nationwide.
After deploying Lerwee Monitoring, headquarters built layered asset views for provincial‑municipal outlets. New store hardware is fully onboarded via segment scanning, with bulk templates applied in one click. Maintenance records and responsible‑party information for all devices are archived centrally online. During incidents, no spreadsheet look‑ups or person‑hunting are required. Complete nationwide asset visibility drastically reduces cross‑regional asset O&M costs.
Unified Observability for All Hosts, Compatible with Domestic‑Innovation and Traditional Hybrid Architectures
During digital transformation, government‑enterprise, healthcare and manufacturing organizations commonly face challenges amid domestic‑innovation migration transition periods. Computer rooms run mixed operating‑system environments including Windows, Linux, Kylin, Tongxin and Euler. Running two separate monitoring systems results in data silos and inconsistent views. O&M staff must switch repeatedly between platforms, losing global visibility over host performance and process states, while hidden faults go undetected.
Lerwee Unified Monitoring delivers broad OS compatibility, enabling management of all hosts within a single dashboard. The platform collects comprehensive performance metrics 7×24‑hours non‑stop: CPU load, memory consumption, disk utilization, disk I/O, business ports, background processes, middleware and database statistics, capturing every detail of host operation.
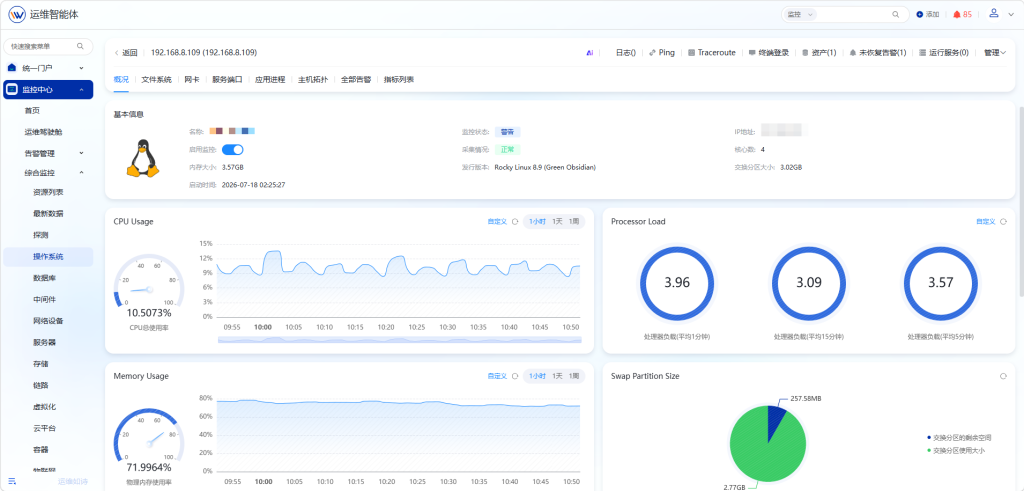
The system automatically inspects core business processes. Alerts at graded severity trigger immediately upon unexpected process exit or service outage to catch risks proactively. One‑click navigation from host pages jumps to virtualization topologies for fast visibility over host‑VM hierarchical relationships, removing the need to toggle between multiple back‑ends for troubleshooting.
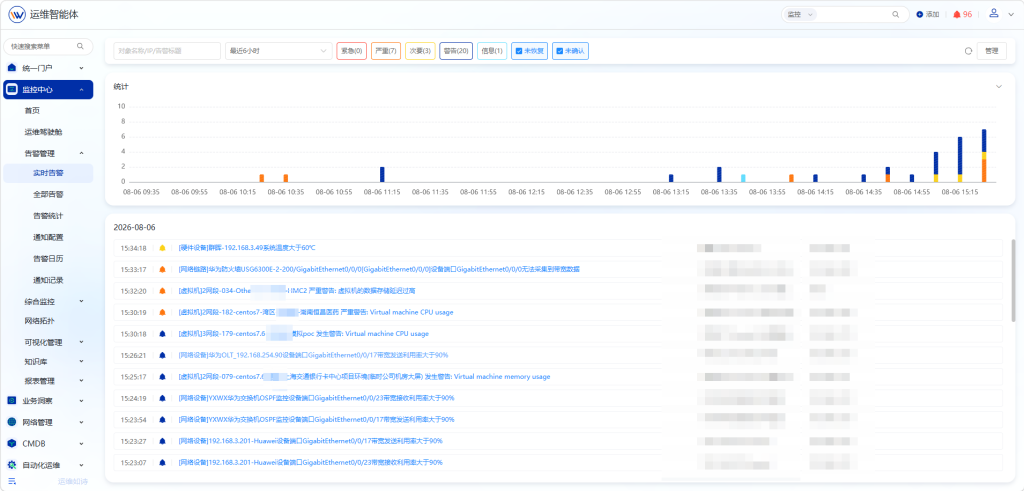
A hospital in Zhejiang leveraged these capabilities to resolve hybrid‑host O&M bottlenecks. Its data center hosted conventional Windows hosts for outpatient services alongside domestic‑innovation servers. Under the prior setup, two disjointed monitoring systems prevented data interoperability; abnormal processes could only be diagnosed via manual remote login. Post‑deployment of Lerwee Unified Monitoring, all business hosts for outpatient billing, lab testing and inpatient administration are centrally onboarded. Core processes are monitored round‑the‑clock, with instant alerts upon anomalies. Manual overnight scheduled inspections are replaced, mitigating patient‑impact disruptions such as registration system lag or outages.
Integrated Network & Dedicated‑Line Monitoring for Rapid Link‑Fault Bottleneck Identification
Financial firms, industrial parks and transportation operators manage intricate network fabrics, with core switches, firewalls, routers, load balancers and inter‑provincial dedicated lines operating in tandem. Conventional network management tools merely report device online/offline status, lacking visibility over port traffic, hardware health and link quality. When services lag or latency spikes occur, O&M teams cannot quickly distinguish between internal network congestion, hardware failure or carrier‑line packet loss/jitter. Link troubleshooting becomes extremely time‑consuming.
Lerwee Unified Monitoring implements in‑depth consolidated monitoring for network hardware and dedicated‑line links. It real‑time collects hardware health metrics for network devices: CPU, memory, port bandwidth, fan and power supply status. Leveraging LLDP and ARP protocols, it auto‑generates complete network topologies illustrating downstream endpoints and business associations for every port.
Multi‑mode dedicated‑line probing via ICMP, NQA and Rping is supported, continuously tracking latency, packet loss and jitter across inter‑provincial dedicated links. Active‑standby link groups can be managed, with dedicated graded alerts triggered upon primary‑link outages. All links bind to asset records for instant access to carrier contact information during failures.
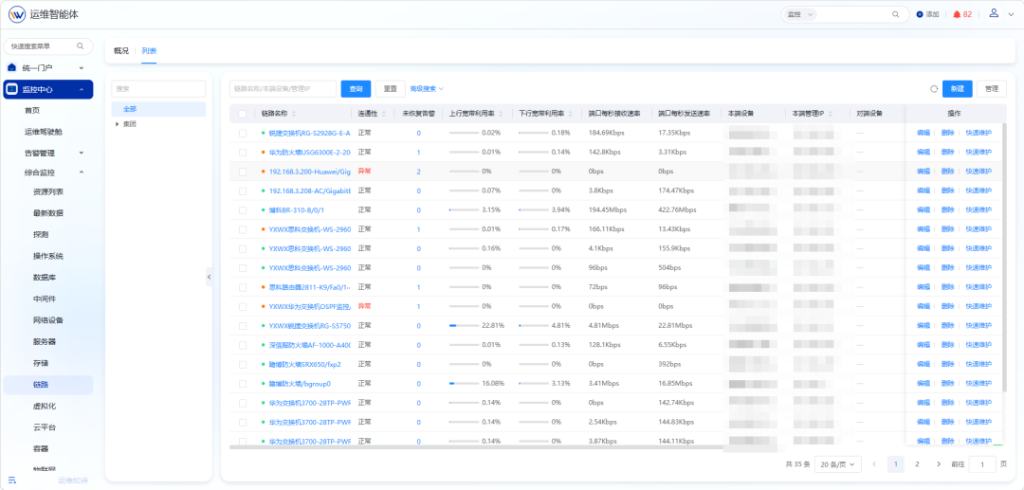
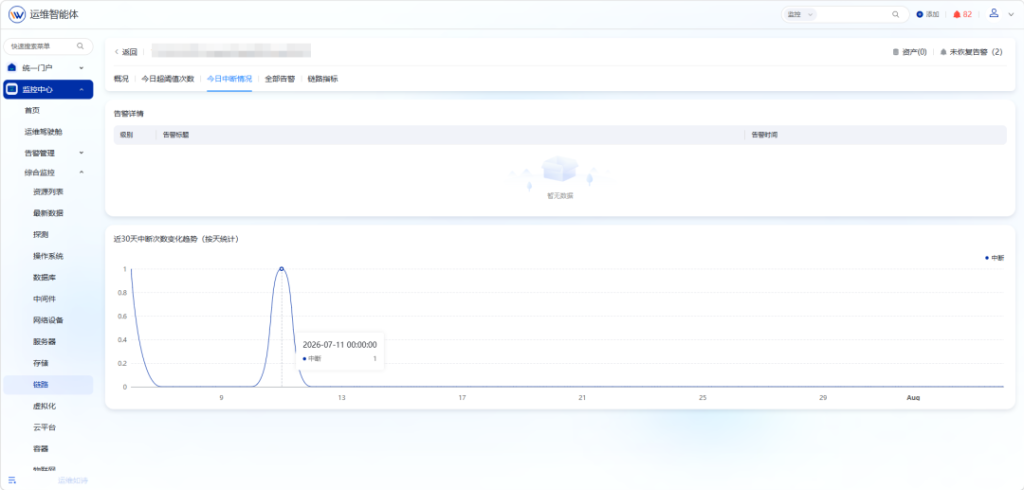
These features were deployed in‑depth for a banking client to resolve heavy‑volume network‑dedicated‑line O&M pain points. The bank operated massive numbers of switches and cross‑provincial dedicated lines. Historically, service slowdowns prompted blind device checks without precise fault‑domain localization. Now internal port traffic and dedicated‑line quality metrics are consolidated in one view. Network anomalies pinpoint failure locations within minutes, differentiating internal‑network faults versus carrier‑line issues and greatly shortening dedicated‑line troubleshooting and resolution cycles.
Multi‑Protocol Distributed Probing, Safeguarding Business Availability Around the Clock
Official websites, educational administration platforms, business portals and online APIs operated by universities, government‑enterprises and internet companies represent user‑facing core services requiring 7×24‑hour reliability. Traditional manual inspection leaves major blind spots. During nights, early mornings and holidays with no on‑call staff, page timeouts, API errors and service crashes are often only addressed reactively after user complaints roll in.
Lerwee Unified Monitoring features full‑protocol distributed probing supporting mainstream methods including Web, PING, TCP, UDP and traceroute, covering monitoring scenarios for websites, business APIs and background services. Multi‑node distributed probing simulates real‑user behaviors such as logins and form queries, going far beyond simple port reachability checks to faithfully reproduce end‑user experience. O&M teams can bulk‑import business sites and configure custom graded alert rules. Instant proactive notifications fire for page timeouts, API malfunctions and unreachable services.
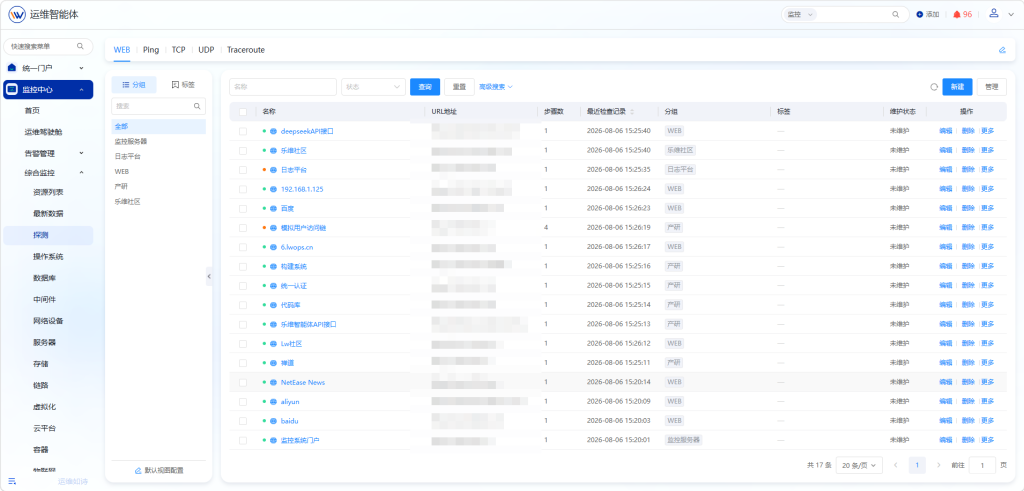
A university in Shanghai adopted this capability to guarantee round‑the‑clock stability for educational systems. Course‑selection platforms, educational administration services, the official website and email systems underpin teaching for faculty and students, out of full reach for manual inspection. The platform configures simulated‑access probing for all educational sites to continuously monitor service availability. Alerts activate upon access degradation, enabling remediation before users perceive issues or submit complaints, solidifying stability for online education services.
Visualized Virtualization Cluster Management for Decoding Complex Underlying Resource Relationships
Financial and manufacturing enterprises deploy heavy workloads on VMware and domestic hyper‑converged platforms. Complex nested hierarchies exist among physical hosts, virtual machines and distributed storage. Virtual‑machine lag, disk exhaustion and performance jitter occur frequently. O&M engineers struggle to differentiate whether issues stem from per‑VM resource shortages or overall bottlenecks on underlying physical hosts/storage pools. Repeated navigation across virtualization back‑ends for manual investigation yields low efficiency.
Lerwee Unified Monitoring centrally onboard mainstream virtualization and hyper‑converged architectures. It collects multi‑dimensional performance metrics across physical hosts, virtual machines and storage pools, auto‑generating visual virtualization topologies that display hierarchical device relationships and business ownership. When VMs trigger performance alerts, topology nodes flash in highlight. Drill‑down tracing from VM metrics navigates directly to underlying physical host and storage resources to rapidly locate root bottlenecks without switching between disparate systems.
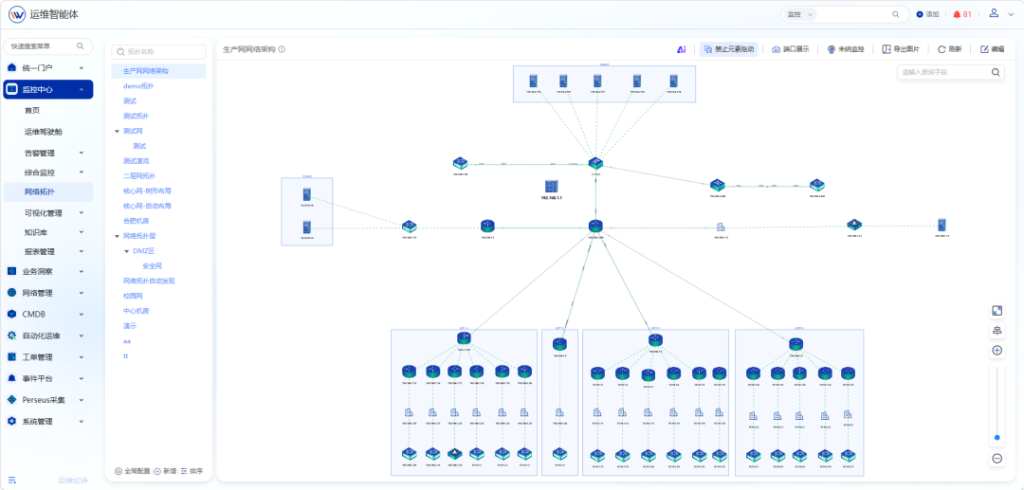
Numerous manufacturing and financial enterprises reduce O&M overhead using this feature. Faced with complex cluster architectures, staff no longer manually map resource dependencies. Topology‑enabled tracing quickly pinpoints performance‑anomaly root causes and distinguishes single‑VM faults versus underlying‑resource bottlenecks, substantially lowering day‑to‑day virtualization‑cluster O&M and troubleshooting costs.
Closed‑Loop Interoperability Across All Modules: O&M with Monitoring, Traceability and Post‑Incident Review
Isolated monitoring modules only expose partial datasets. Fragmented data architectures cannot sustain high‑efficiency operations. Lerwee Unified Monitoring breaks down functional silos to enable deep interoperability among assets, monitoring, topology, alerts, reports and AI analytics, building a complete O&M closed‑loop system.
When performance alerts fire, the system automatically attaches full pre‑ and post‑fault performance trend graphs to reconstruct incident evolution. One‑click jumps from any device lead into network or virtualization topologies, visualizing all impacted business links for fast impact‑scope assessment. Aggregated monitoring data auto‑generate load TOPN rankings and daily/weekly device‑availability reports to support regular data‑driven reviews of data‑center conditions. Powered by AI analytics, the platform continuously learns device operational patterns, proactively identifies latent risks for CPU, memory and storage, and delivers targeted capacity‑expansion and optimization recommendations. O&M evolves from reactive fire‑fighting to proactive operations.
This fully interoperable capability fits all‑industry O&M scenarios. Abnormalities in hosts, networks, storage or links come with traceable evidence, source tracking and analyzable datasets, forming a continuously optimizable, iterable complete O&M system.
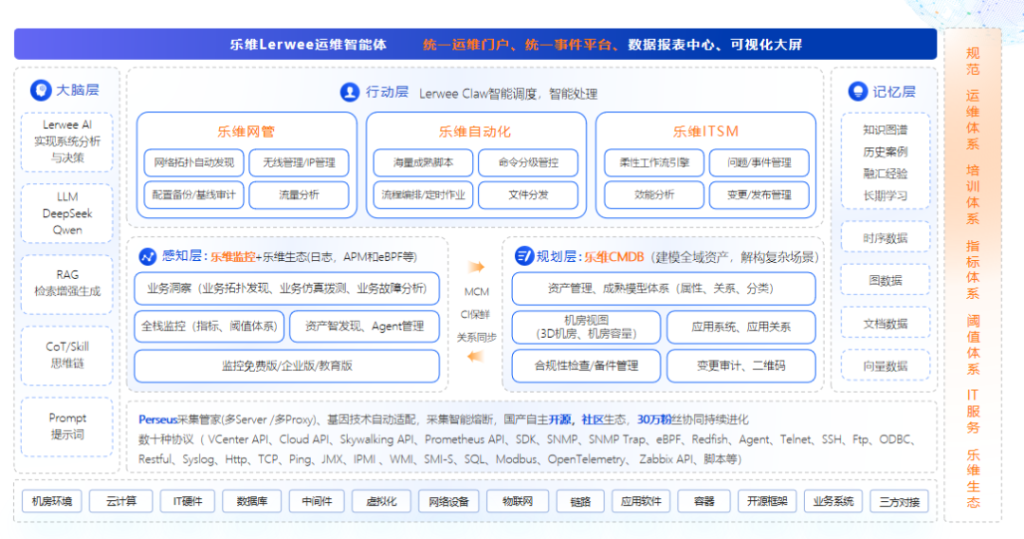
A truly capable monitoring platform is never just a pile‑on of features. It exists to eliminate ineffective work and redundant burdens for O&M practitioners.
Lerwee Unified Monitoring leverages one single platform to manage the full infrastructure stack: assets, hosts, networks, dedicated lines, business probing and virtualization. It puts an end to legacy O&M pain points: disjointed toolchains, messy asset ledgers and blind troubleshooting workflows. Use‑cases span cross‑regional asset governance for chain‑store businesses, hybrid domestic‑innovation host O&M in hospitals, in‑depth dedicated‑line monitoring for banks, core‑service assurance for universities and refined virtualization‑cluster management for enterprises. It adapts to real‑world O&M scenarios across every vertical.
Gain visibility, clear governance and fast troubleshooting for full‑domain IT resources. Empower O&M teams to move beyond constant fire‑fighting and confidently sustain stable operation of entire IT architectures.
- SSL Certificate Automation: Total Game-Changer
- Release of Lerwee Network Management Platform 8.0
- Launch of the First Full-Toolchain Operations Agent 2.0
- Lewei Invited to Volcengine FORCE Original Power Conference
- Lerwee Encyclopedia: Why Zabbix Wins Favor Among O&M Firms Worldwide?
- A Brief Discussion on the Differences Between Zabbix and Prometheus
 Chinese (China)
  Chinese (Hong Kong)