
Visualized O&M Monitoring | Make Faults Visible, Locatable and Controllable
The exponential growth of O&M data has plagued O&M teams with persistent issues including disorganized data, delayed fault troubleshooting and ambiguous business status, which has become a bottleneck hindering the upgrade of O&M efficiency. Lerwee Monitoring breaks down the barriers of abstract data through O&M visualization, transforming dispersed O&M metrics, topological relationships and business status into intuitive and perceptible visual forms. This makes the status of the entire O&M lifecycle perceivable, problems rapidly locatable, and decision-making backed by solid data support.
It intuitively and efficiently presents O&M data through a diverse range of visualization forms including the O&M cockpit, cast screen views and monitoring dashboards, enabling the real-time display of core metrics and flexible adaptation of operations. This empowers O&M personnel to quickly grasp the overall situation and gain in-depth data insights.
O&M cockpit:
Core metrics including resource overview, alert summary, system load, top 10 alert objects and top 10 CPU/memory utilization rates are visualized in one screen for a panoramic view of the overall O&M status, ready to use out of the box.
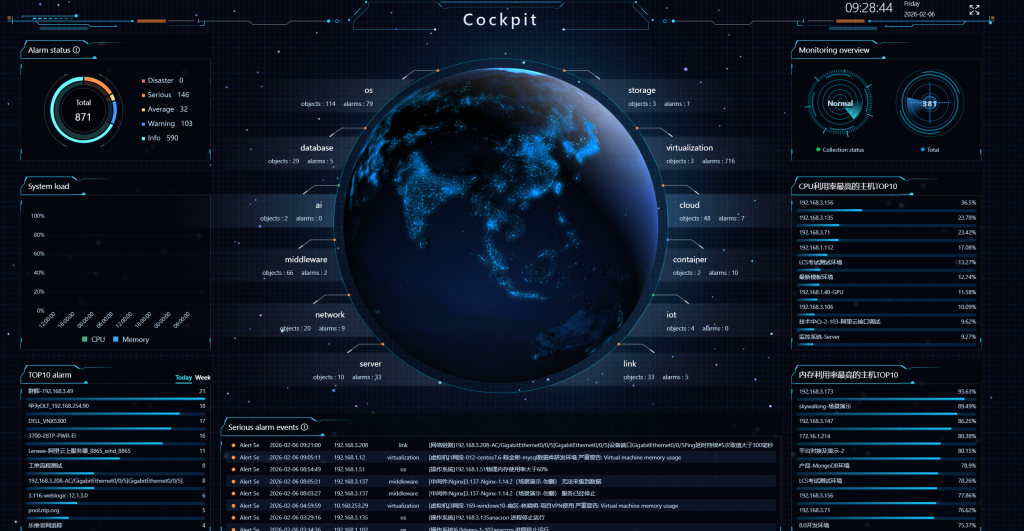
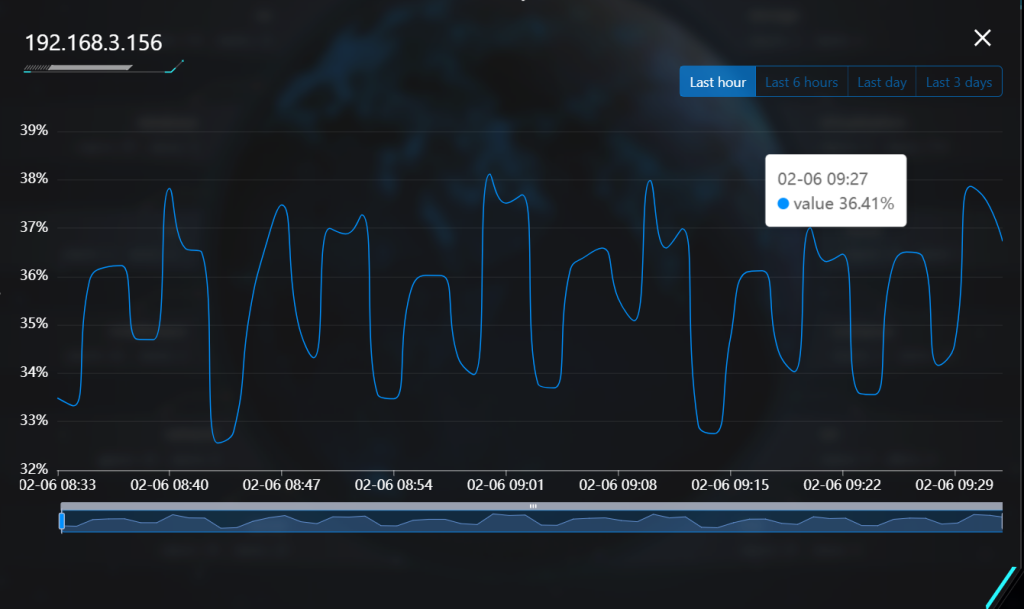
Click on the names of metrics such as the Top 10 CPU/Memory Utilization Rates to view the corresponding data line charts.
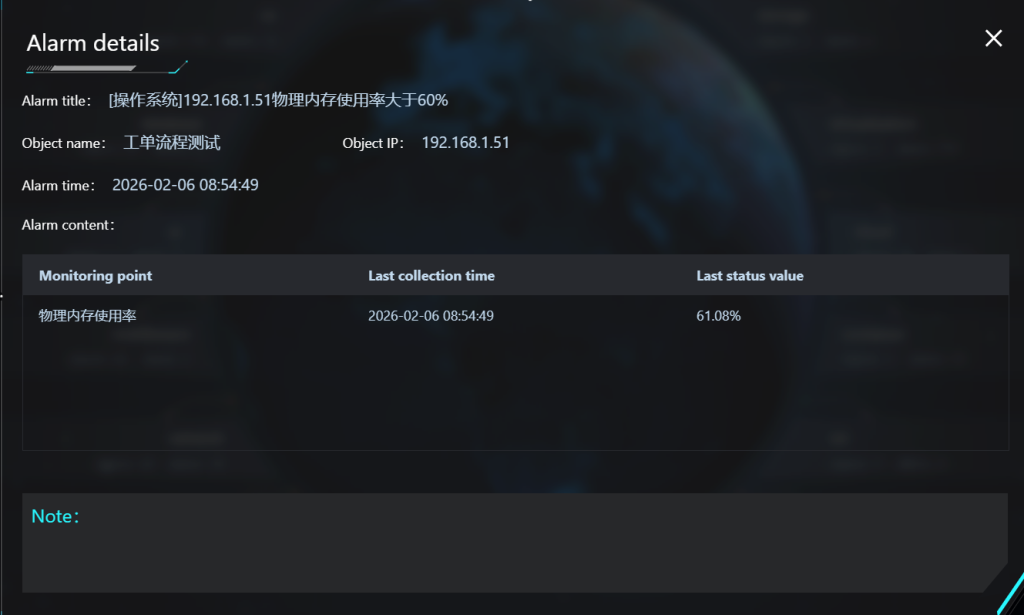
Rotate through critical alert events; click to view alert details.
Smart BI
BI Visualization enables seamless connection to multiple data sources and empowers users to freely design visualization dashboards. It comes with over 30 professional visualization components such as line charts, 3D dashboards, donut charts, dynamic wave charts and more, and supports topological relationship visualization as well as real-time presentation of alert lists. All components allow custom configuration of colors, sizes, dynamic effects and other attributes, featuring flexible layout and typesetting. The dashboards support screen projection display across multiple terminals and integrated permission management.
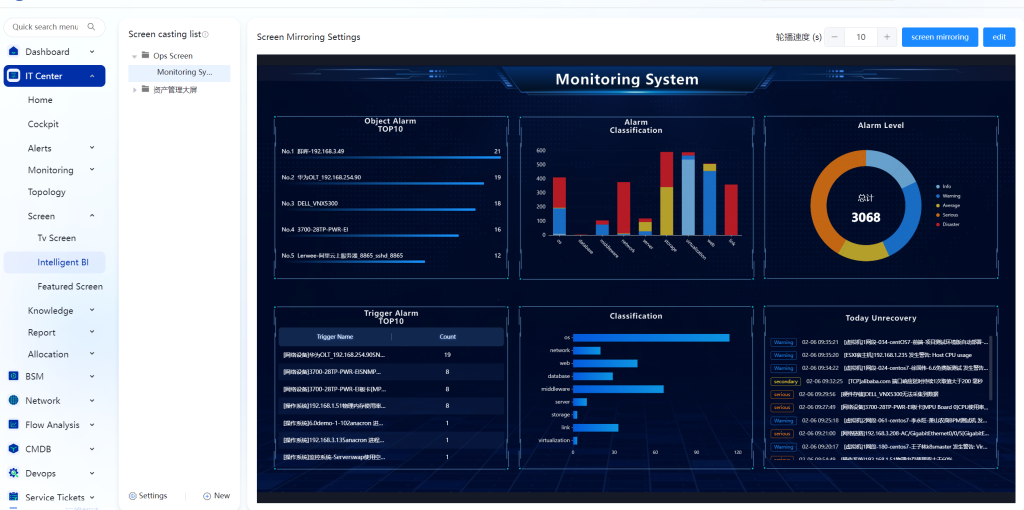
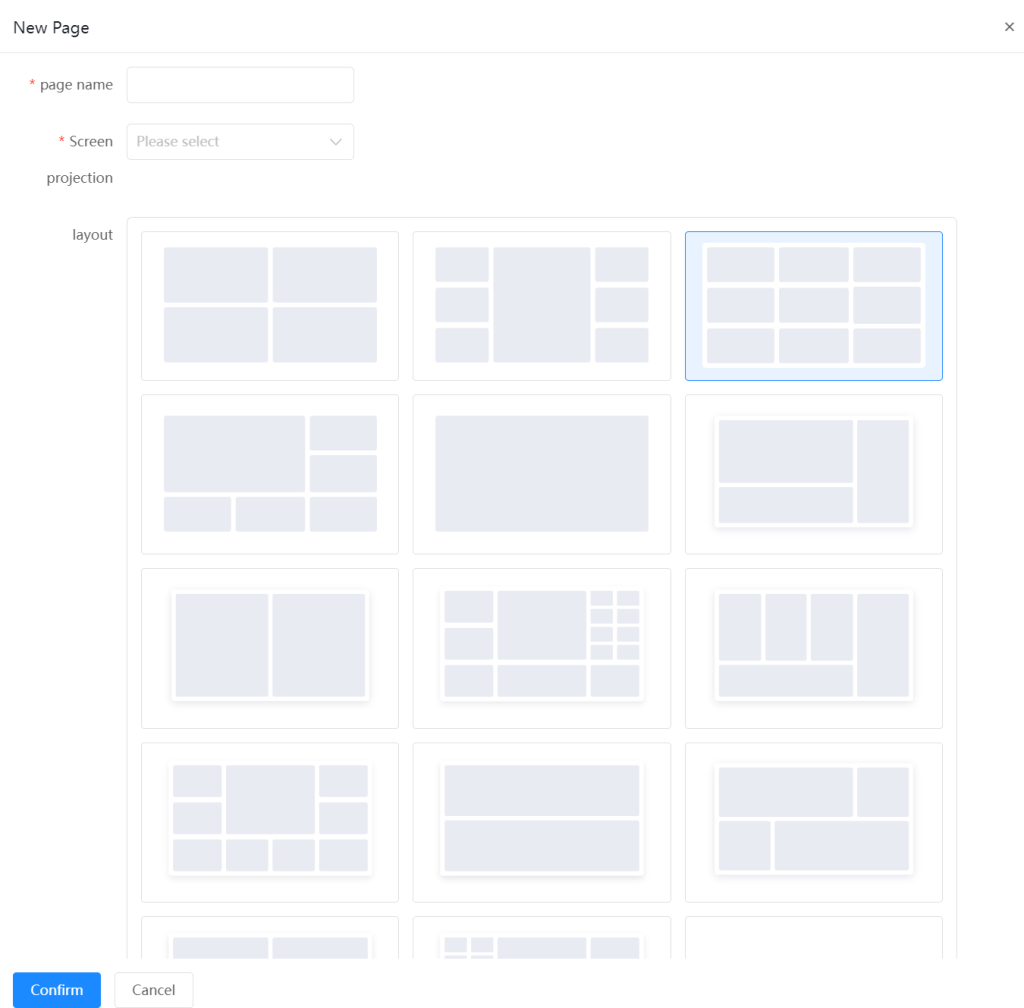
Cast Screen Views
Configure host system management views, database monitoring management views, network device monitoring dashboards and more independently.
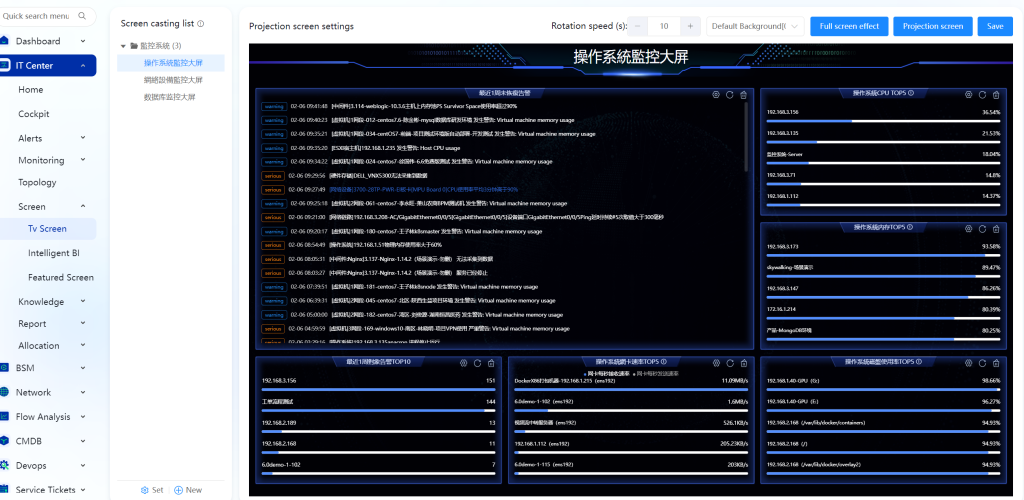
The system comes with a variety of built-in layout modes and supports drag-and-drop layout adjustment. It offers rich display styles including line charts, dashboards, donut charts, pie charts, bar charts, wave charts, topology charts and more, with support for data drill-down.
Customize the configuration of cast screen cards, adjust the carousel speed and set the theme background.
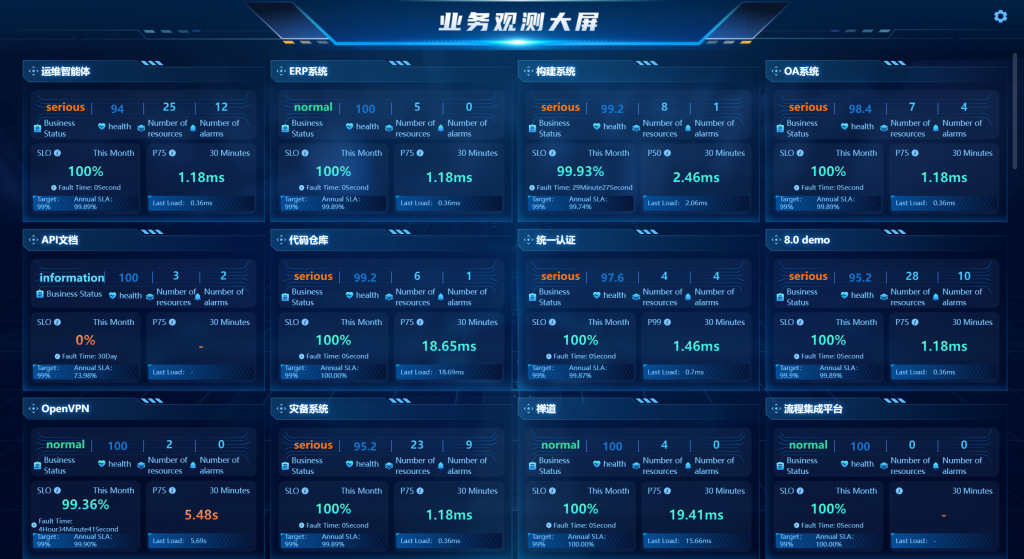
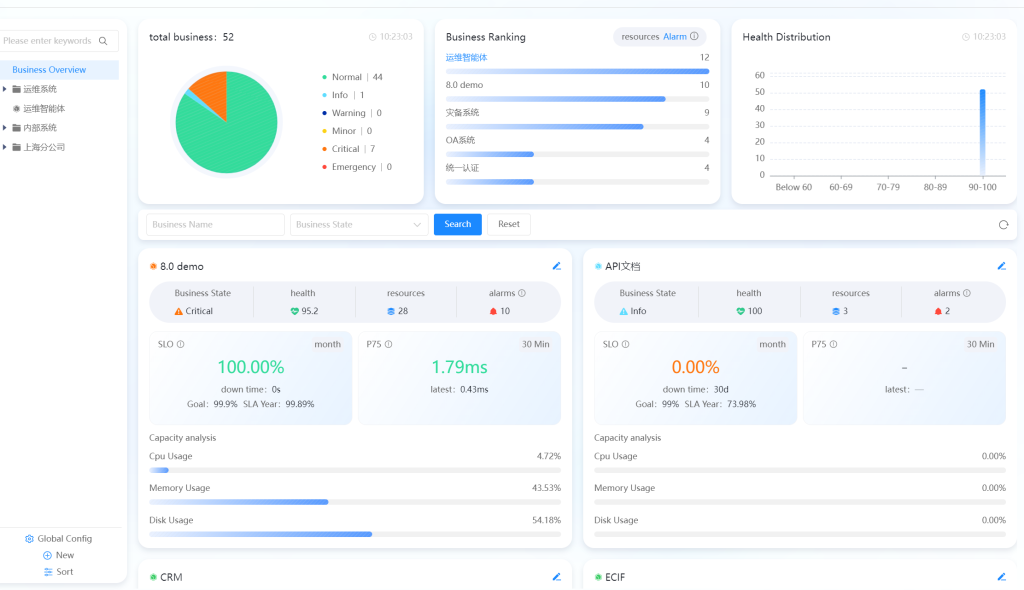
Business Monitoring Dashboard
Equipped with exclusive display modules for business architectures (e.g., OA systems, ERP systems, code repositories, disaster recovery systems, etc.). It identifies business status (normal/abnormal) and presents health scores, resource/alert counts, SLO (Service Level Objective) achievement status for business services, P75 load metrics and more.
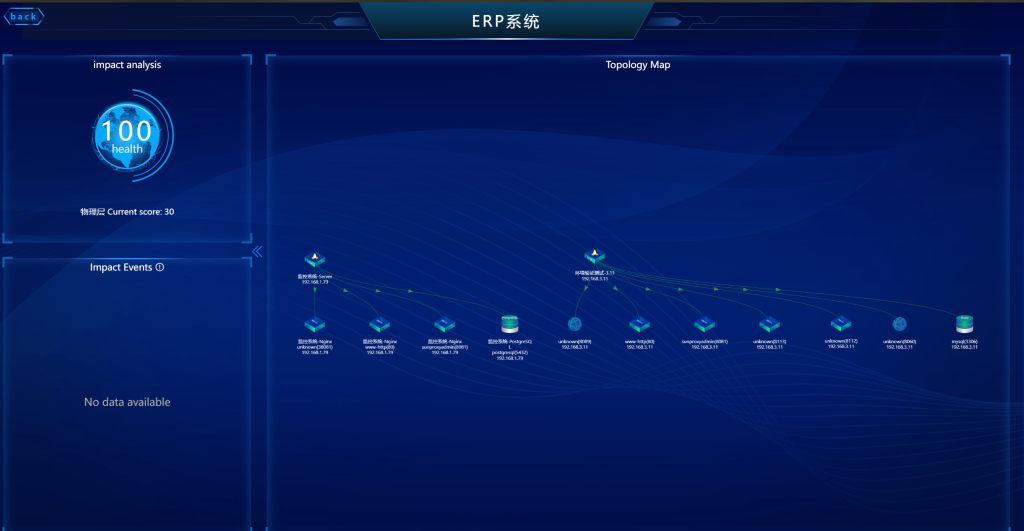
Click to view in-depth business system impact analysis, related impact events and topology charts, and identify fault nodes via the topology charts.
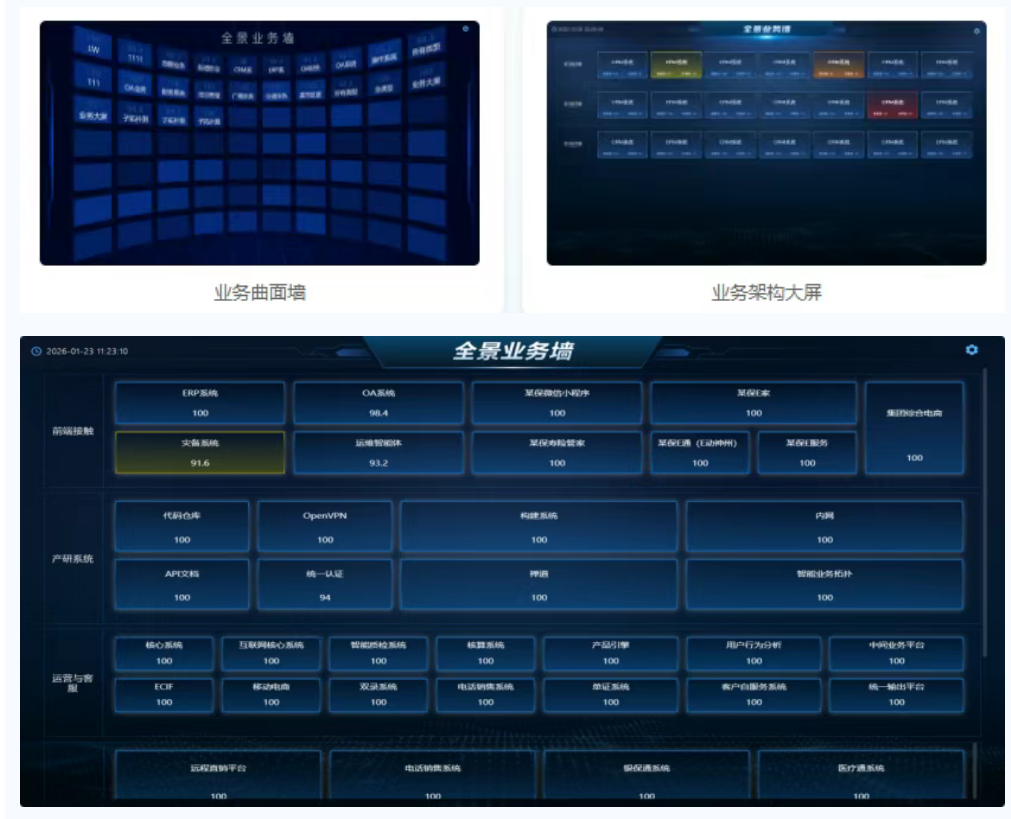
Panoramic Business Wall
It supports flat and curved display modes and identifies the health status of business systems; click to view in-depth business system impact analysis, related impact events and topology charts, and identify fault nodes via the topology charts.
Topology-Linked Precise Fault Handling
Based on the network, business and virtualization topology systems, and combined with alert visualization capabilities, it builds a full-process fault handling link of Alert Perception – Topology Positioning – Root Cause Tracing. Relying on multi-level visualization and intelligent management capabilities, it greatly improves the efficiency of fault response and handling.
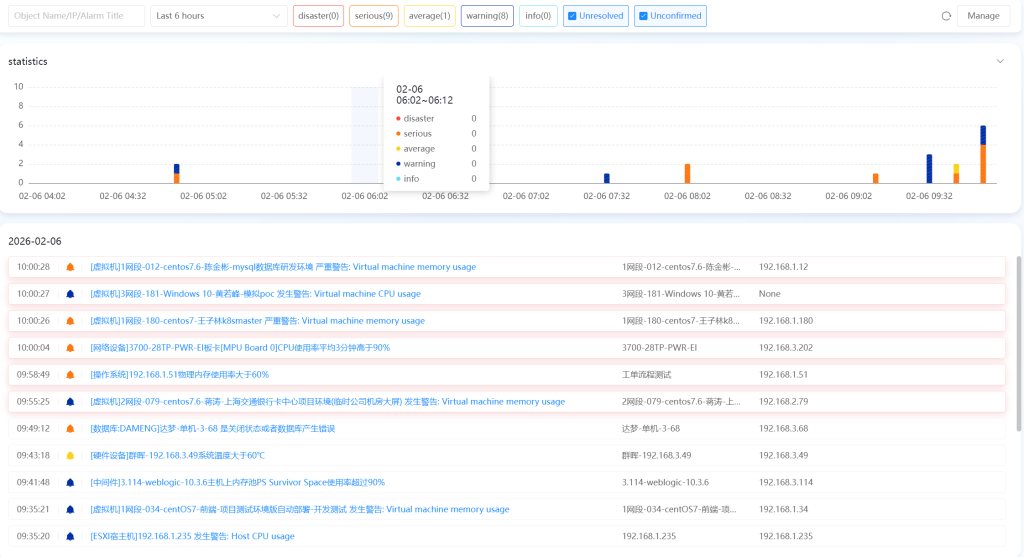
Visualized Centralized Alerting
Multi-period and multi-level alert statistics, and real-time display of the latest alerts.
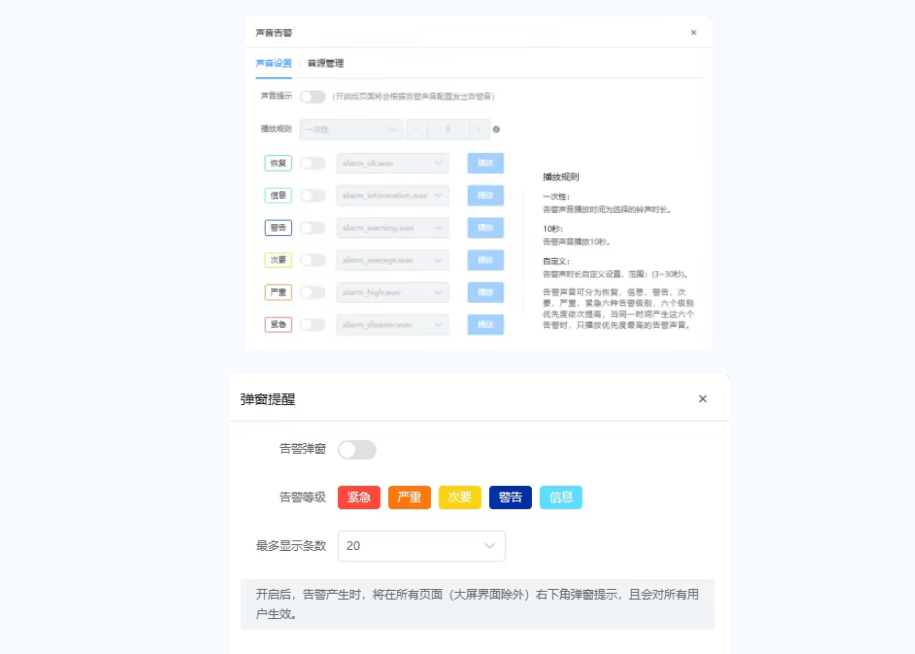
Configure audio and pop-up reminders by alert level.
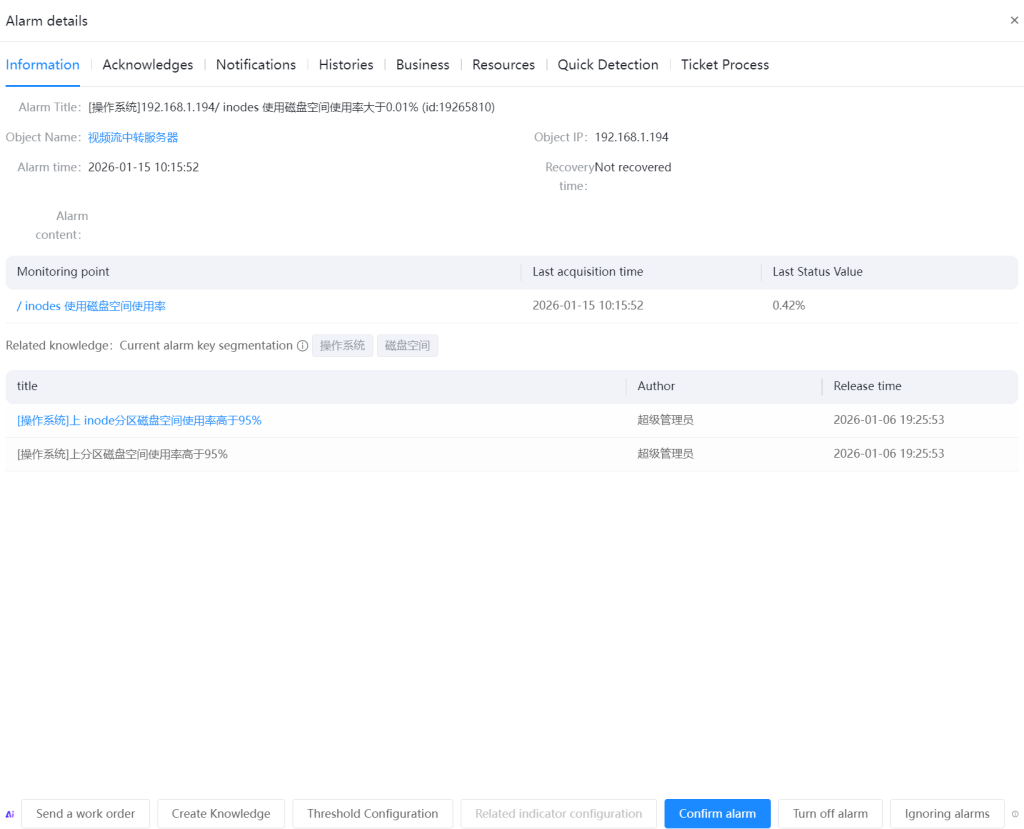
Click on the title to view alert details (basic information, confirmation status, alert notifications/history, impact scope, asset information).
Network Topology
Automatically discovers network devices, servers and storage based on network protocols to generate relationship diagrams.
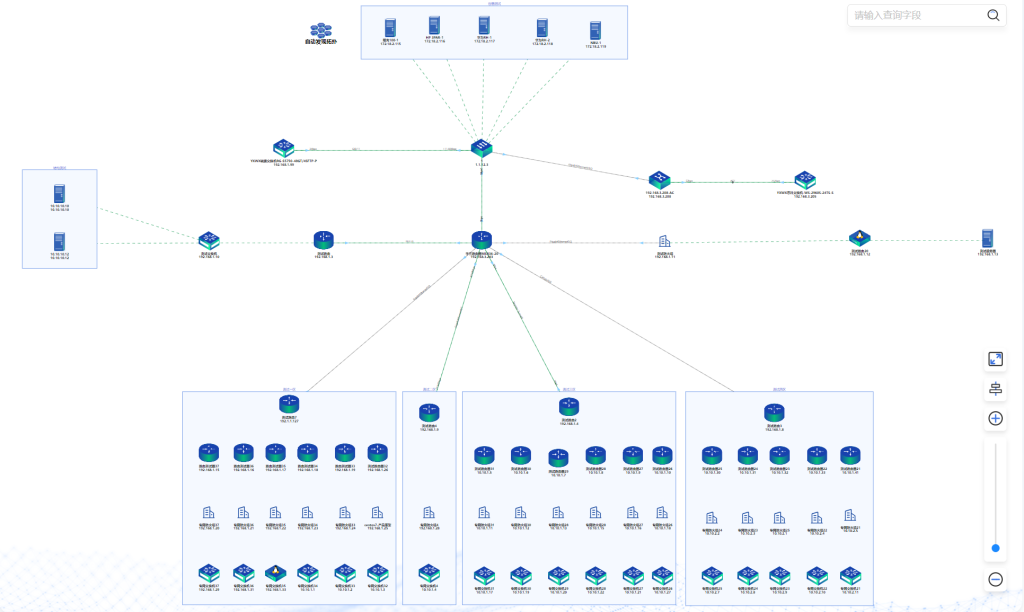
Identify abnormal network resources via bandwidth utilization, traffic trends and alert flashing indicators; click on the abnormal indicators to view alert details.
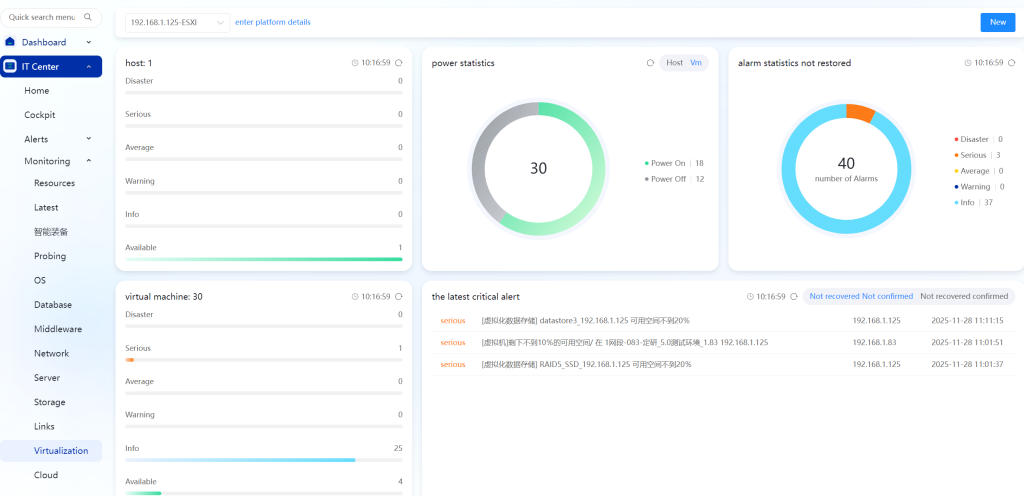
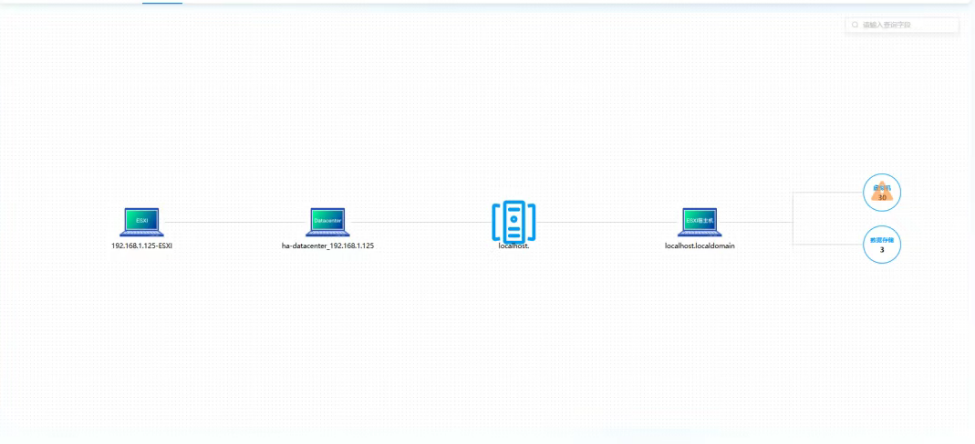
Virtualization Topology
Virtualization monitoring, alert statistics for physical hosts and virtual machines, power status (on/off) statistics, unresolved alert statistics, and the latest critical alerts.
It automatically generates a virtualization topology and fully presents the logical architecture and dependencies of the platform-physical host cluster-virtual machine instance-backend data storage hierarchy. It supports layer-by-layer drill-down to view associated alert details and performance metrics, enabling quick location of abnormal nodes.
Business Observability
Focusing on the stable operation of the entire business lifecycle, it enables real-time oversight of business status and in-depth analysis of operational data through quantitative indicator monitoring and dynamic health assessment.
Business Quantitative Monitoring & Analysis
Quantitatively display business health scores, the TOP list of resource consumption and alert rankings, conduct multi-dimensional SLO monitoring, and perform P75 load analysis.
- Essential O&M Tool: Server Monitoring Insights
- Fully open all functions | Lerwee O&M intelligent agent free version out now
- A Brief Discussion on the Differences Between Zabbix and Prometheus
- Release of LerweeAOM V8.0
- A Comparative Analysis of Lerwee Network Management and SolarWinds
- A Brief Analysis of Zabbix_get Basic Commands