
Network visualization detection enables rapid troubleshooting
As enterprise network architectures become increasingly complex, operational and maintenance requirements such as web services, network connectivity, and business processes are intertwined and overlapping. Traditional monitoring tools are often limited to single metric collection, making it difficult to address fault localization, performance optimization, and business assurance requirements in complex scenarios. For instance, they cannot simulate real business operation processes such as user login and user queries, and struggle to visually present network transmission paths and node statuses. This results in time-consuming and laborious fault localization, difficult to accurately identify performance bottlenecks, and severely impacts business continuity and user experience. LeWei Monitoring breaks down the barriers of data fragmentation through multi-scenario detection, flexible alert mechanisms, and intuitive visualization, constructing a network link perception system from the underlying network to the upper-level business, effectively addressing core operational and maintenance pain points.
PART 01 Multi-scenario Detection Coverage
Lerwee closely aligns with the actual operational and maintenance scenarios of enterprises, establishing a comprehensive detection system that covers core aspects such as Web services, network connectivity, and route tracing. This system enables seamless monitoring from the basic network layer to upper-level business operations, accurately responding to core operational and maintenance needs. 01 Web Service Deep Monitoring: As the core entry point for enterprise digital interaction, the stability and response speed of Web services directly impact user experience. Lerwee Monitoring provides refined detection capabilities for Web scenarios. It not only collects core metrics such as response time, response code, service status, and response speed of URL addresses in real time but also achieves deep expansion of multi-step monitoring—simulating user logins, user queries, and other business operations to restore end-to-end experience monitoring in real business scenarios, accurately meeting the core operational and maintenance needs of enterprises for “business availability + user experience + precise fault localization”.
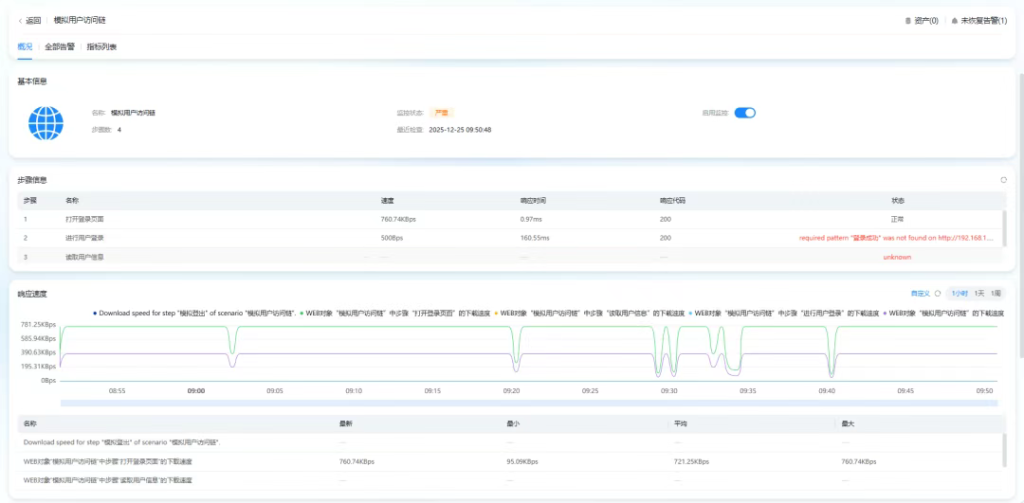
For example, in the scenario of multiple branches of an operator, a business hall reports sluggish access to the headquarters’ business system, while access from the headquarters and other branches is normal. By using LeWei Monitoring Web probes and initiating probes on both abnormal and normal branch clients, simulating real operations such as login and query, and comparing response times and link data, it is possible to quickly determine whether the issue is related to the local network of the branch or the operator’s line, and accurately pinpoint the faulty node.
02 Multi-protocol network connectivity detection
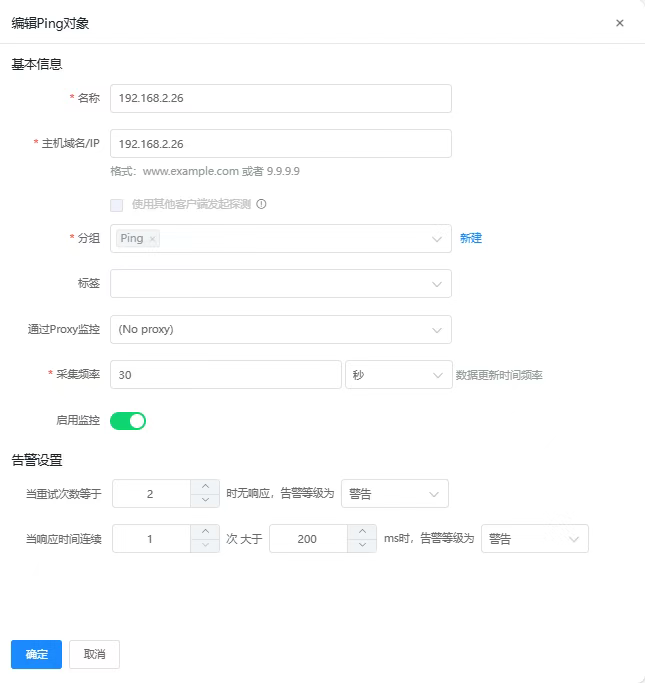
For network layer connectivity monitoring needs, Lerwee fully supports mainstream probing protocols such as Ping, TCP, and UDP, enabling rapid verification of network reachability, port open status, and data transmission stability between devices. Whether it’s connectivity testing between servers and terminals or availability verification of core business ports, real-time monitoring can be achieved through simple configuration. Additionally, the platform provides a flexible management view for probing types, supporting the free adjustment of probing order based on operation and maintenance priorities. This ensures that monitoring tasks related to core business receive priority responses, guaranteeing the precise implementation of key operation and maintenance goals.
03 Visual route tracing
In network troubleshooting, issues such as routing anomalies and node sluggishness are often highly concealed, and traditional troubleshooting methods are time-consuming and laborious. The Traceroute detection function of Lerwee monitoring achieves visual diagnosis of network paths: it supports the intuitive display of the complete transmission path of data packets from the source to the destination in a graphical manner, clearly presenting each router node passed through, node response time, and data transmission status. When the network encounters issues such as excessive latency or connection interruptions, operation and maintenance personnel can quickly locate the abnormal node through the route tracing chart, accurately determining whether the problem is caused by link congestion, abnormal route hops, or node failure, significantly reducing the difficulty of network diagnosis and gaining valuable time for fault repair. For example, the core of the route tracing capability displayed on the interface is the network path diagnosis capability of “visualization + multi-time period comparison”, which can be specifically broken down into three practical value points:
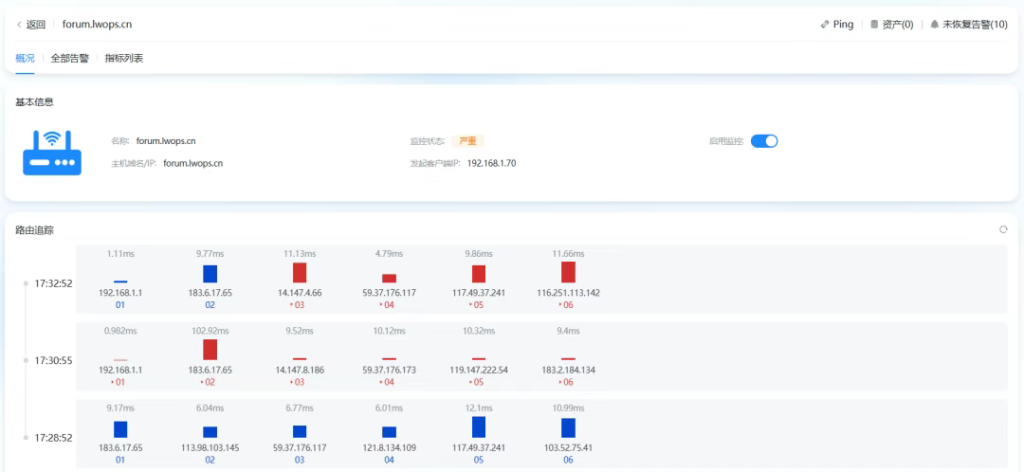
The full visualization of path nodes clearly displays the complete routing nodes (such as 192.168.1.1, 183.6.17.65, etc.) from the initiator (192.168.1.70) to the target domain name (forum.lwops.cn). Each node is labeled with response time, and the status is distinguished by color (blue represents normal response, red represents delay/abnormality), allowing operation and maintenance personnel to locate “which node is problematic” at a glance. Multi-time period tracking and comparison support the display of routing paths at different time points (three time periods shown in the figure: 17:32:52, 17:30:55, 17:28:52), enabling the observation of response changes at the same node at different times and the detection of fluctuations in routing paths (such as different node IPs passing through at different time periods) – this helps troubleshoot issues such as “intermittent network failures” or “dynamic route instability”. Fault correlation and localization, combined with monitoring status (currently displayed as “critical”), can directly link the abnormal nodes identified by route tracing to the unavailability status of the business system, quickly determining that “it is a network node failure that caused the business interruption”, avoiding repeated troubleshooting between the business layer and the network layer by operation and maintenance personnel. Simply put, this route tracing capability “turns the network black box into a visual white box”, especially suitable for rapid localization of network failures and long-term monitoring of route stability.
PART 02 Flexible Configuration and Intelligent Analysis
Based on comprehensive detection, LeWei Monitoring transforms monitoring data into effective support for operation and maintenance decisions through flexible alarm configuration and deep data mining, achieving an operation and maintenance upgrade from “passive response” to “active prevention”.
01 Personalized alarm settings
For alarm requirements in different scenarios, LeWei Monitoring provides highly flexible configuration options: it supports customizing alarm triggering conditions based on retry times and continuous response time, and can set differentiated alarm strategies according to business importance to avoid interference from invalid alarms. At the same time, the platform integrates multiple notification channels to ensure that alarm information can reach relevant responsible persons in a timely manner through the optimal path, enabling rapid response to abnormal situations. In addition, users can customize and view trend charts of indicators within the recent period, accurately identify patterns of performance fluctuations through comparative analysis of historical data, and predict potential risks in advance.
02 Data visualization and trend analysis
Lerwee monitoring not only focuses on real-time data collection, but also emphasizes data interpretation and presentation. For various detection indicators, the platform automatically generates intuitive trend charts, which clearly display through visualization whether it is changes in the response time of Web services, fluctuations in the stability of network connectivity, or trends in response delays of routing nodes. Operation and maintenance personnel can quickly locate performance bottlenecks through trend analysis – such as abnormal situations where the response time of Web services continues to rise or the response delay of a certain routing node suddenly increases. By combining business scenarios with root cause analysis, they can provide accurate data support for decisions such as network optimization, resource expansion, and configuration adjustments.
PART 03 Operation and Maintenance Value Upgrade: Triple Improvement in Efficiency, Cost, and Safety
Lerwee monitoring, with comprehensive detection capabilities at its core, brings multi-dimensional value transformation to enterprise operation and maintenance management, becoming a core support tool for enterprise network operation and maintenance in the digital era. It integrates and visually presents network link data, quickly locates various faults such as Web services, network connections, and routing nodes, significantly reducing troubleshooting time. Multi-step monitoring replaces manual simulation operations, reducing repetitive workload. Through real-time collection of Web response data, network load indicators, and other metrics, it clearly grasps the actual usage of resources such as servers and bandwidth, avoiding procurement waste caused by blind expansion, while reducing the cost of idle resource occupation and improving resource utilization. It configures exclusive alerts and priority detection strategies for core business configurations, capturing potential risks such as performance fluctuations and routing anomalies in advance, avoiding user operations being affected by Web sluggishness and network disconnection, and ensuring continuous and stable business operation.
- Visual network traffic analysis
- New Features | Key Update Features for LeWei Products in June
- Monitoring new forces vs. traditional powerhouses: Why can LeWei intelligent monitoring replace Tivoli?
- SSL Certificate Automation: Total Game-Changer
- Release of LerweeAOM V8.0
- How IT Monitoring Systems Reduce Suspicious Activity Rates for Enterprises