
Better Monitoring, Here with “7” | Lerwee Monitoring V7.0 Released
From ChatGPT to Sora, and then to Grok-1, artificial intelligence models are becoming increasingly powerful and their applications are becoming more mature; From A100 to B200, GPU, as the fundamental computing power of artificial intelligence, has achieved a leapfrog development… It is foreseeable that in the near future, artificial intelligence will be widely and deeply applied to all aspects of our lives and work.
In the field of IT operations, the replacement of traditional operations by intelligent operations is unstoppable. LeWei continues to explore and try the combination of big data, big models, and intelligent operation and maintenance. After more than a year of polishing, LeWei’s intelligent monitoring platform V7.0 is officially unveiled today.
As is widely known, Leviwatch Monitoring has become a phenomenal product in the industry. The Leviwatch Intelligent Operations and Maintenance (I&O) Solution, with Leviwatch Monitoring as the entry point and CMDB, Network Management, and iBSM as value-added modules, encompasses strategic surrounding products such as ITSM, Automation, and Event Platforms, forming four key characteristics: Asset Discovery, Full-Stack Monitoring, Digital Business, and Open-Source Compatibility.
PART 01
More Comprehensive Business Services (iBSM)
Leviwatch Monitoring has always adhered to a customer-centric approach, with the ultimate goal of ensuring the stable operation of customer business systems. To this end, Leviwatch Monitoring has broken down the barriers between operations and business, achieving automatic discovery of full-stack, end-to-end business topologies. By simply inputting an IP address, it can automatically discover the relationships between business hosts, ports, and application processes. Leveraging business topologies, users can intuitively identify business anomalies and their impact scope. Additionally, it provides a panoramic business wall for visualizing business clusters. Building on this foundation, Leviwatch Monitoring V7.0 further enriches its business service capabilities:
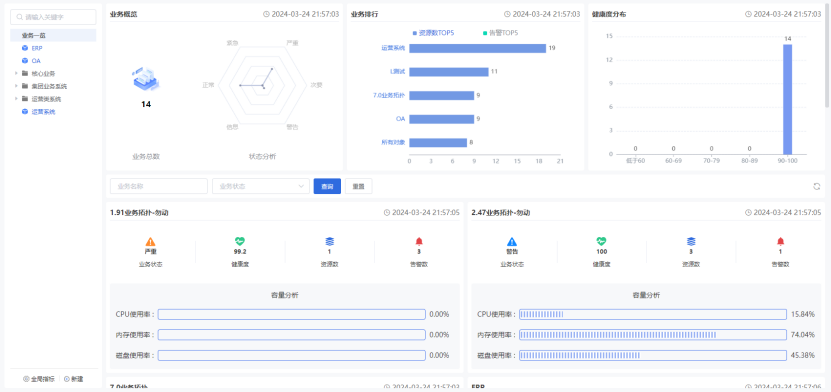
01 Business Overview: Quick Perception of the Entire Business Landscape
The Business Overview is a global display interface that provides a clear and comprehensive business profile, including business status analysis, business resource rankings, business alert rankings, and business health distribution. It helps users gain a holistic understanding of business conditions, monitor operations, effectively support business analysis, and enhance user experience.
Furthermore, users can extract core businesses and display them in a card format on the overview interface for focused monitoring, effectively reducing page navigation and switching.
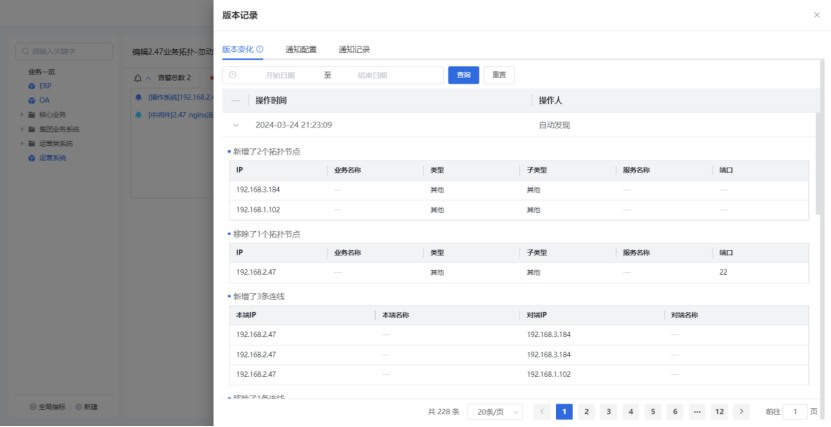
02 Business Version: Tracking and Managing Business Changes
The Business Version feature records changes in business topologies. Users can track and manage the complete change process of business structures (who made the change, what was changed, and when it was changed, i.e., the 3Ws). It allows for configurable change alerts, which can be synchronously notified to team members or relevant stakeholders, improving transparency and control over change management.
For example, after Operations Team Member A performs a version upgrade on the company’s ERP system, the monitoring system can push notifications to other team members and the team leader. By clicking on the notification, they can view detailed change information.
03 Optimized Business Capacity and Business Tree: Upgrading Business Management
Leviwatch Monitoring 7.0 integrates Business Capacity and Business Tree into the Business Topology, forming a new [Business Management] module. After optimization, the new Business Host Capacity Analysis supports viewing the current number of hosts, overall CPU utilization, and overall memory utilization, with the ability to drill down to specific metrics layer by layer.
PART 02
More Flexible Alert Calendar
01 Calendar Management: Meeting Periodically Changing Monitoring Needs
The Alert Calendar is designed for industries with strong periodic business changes, such as securities and futures. During business operation periods, such as securities and futures trading hours, trading systems generate large amounts of transaction data accompanied by high concurrency. During non-operation periods, only a few underlying modules maintain basic operational status.
The Alert Calendar can configure different monitoring modes for these two distinct states: full-scale, high-performance monitoring during operation periods to ensure flawless performance; and reduced-dimension monitoring during non-operation periods, monitoring only the underlying modules required for operation to minimize performance waste.
Additionally, the Alert Calendar supports various dimensional settings:
- Business metric monitoring rules allow for setting multiple time periods within a day and viewing trading time information on the panel.
- Supports periodic settings for managing trading times by day, week, workdays, non-workdays, etc. For example, futures trading times are fixed daily and repeat weekly on workdays. Futures companies can typically plan the following year’s schedule before the Spring Festival and set it up all at once.
- Provides online holiday maintenance functionality, allowing adjustments based on industry holiday schedules.
PART 03
More Powerful Fault Self-Healing
01 Fault Self-Healing: Enhancing Automation and Intelligence
Fault Self-Healing can automatically trigger corresponding fault handling scripts based on preset rules and strategies to restore system functionality. It effectively reduces manual intervention, improves system stability and availability, and enhances operational efficiency.
For example, when insufficient system disk space is detected, the platform triggers an alert and automatically activates a script to clear log files and free up disk space. When Linux user passwords are required to be changed every three months for audit purposes, the platform triggers a password expiration notification and can automatically modify passwords using a password change script.
PART 04
More Functional Optimizations
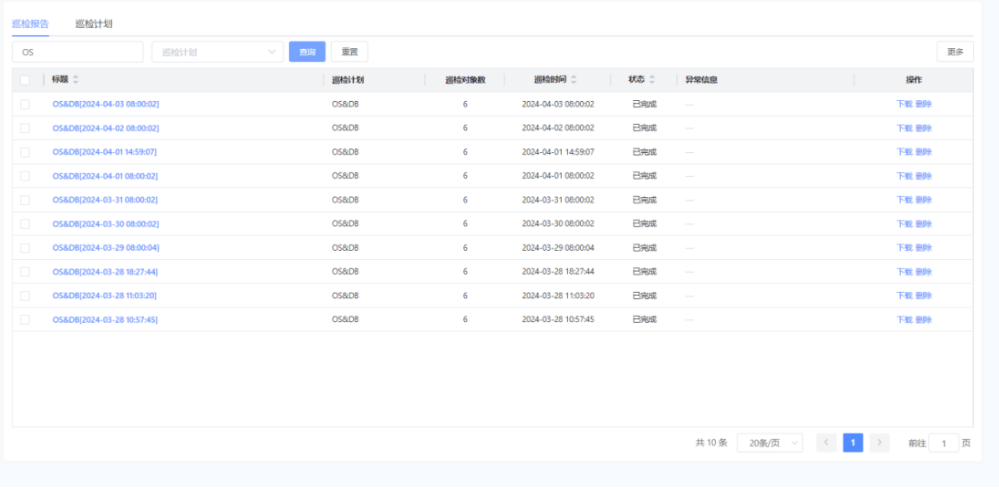
01 Inspection Reports: Quickly Identifying Maintenance Needs
Inspection Reports provide recording and analysis of equipment and system operational data. Professional operations personnel can use inspection reports to gain a comprehensive understanding of equipment or system usage and identify maintenance needs, ensuring timely repair and maintenance work to enhance equipment reliability and system stability.
Inspection Reports support both manual and automatic system inspections, with customizable configurations for inspection tasks, metric content, and inspection cycles.
02 Report Management: More Flexible Statistics
In previous versions, the reporting system only supported filtering and statistics by object. When dealing with a large number of complex object types, object filtering efficiency significantly decreased, and generated reports were more prone to errors. Leviwatch Monitoring 7.0 introduces three new classification methods (grouping, tags, types), making report statistics more efficient and flexible.
Additionally, report exports now support Excel and Word formats in addition to the original image format.
Graphical reports support month-over-month data statistics and comparison, with month-over-month intervals supporting daily, weekly, and monthly options.
03 Threshold Maintenance: Multi-Point Detection
Metric threshold maintenance has been optimized. The new threshold metric list is associated with triggers, allowing for customizable configuration of metric thresholds for quick threshold maintenance.
Multi-Point Detection: For Ping, TCP, and UDP protocols, users can select any client as a site to initiate detection, addressing multi-point detection issues.
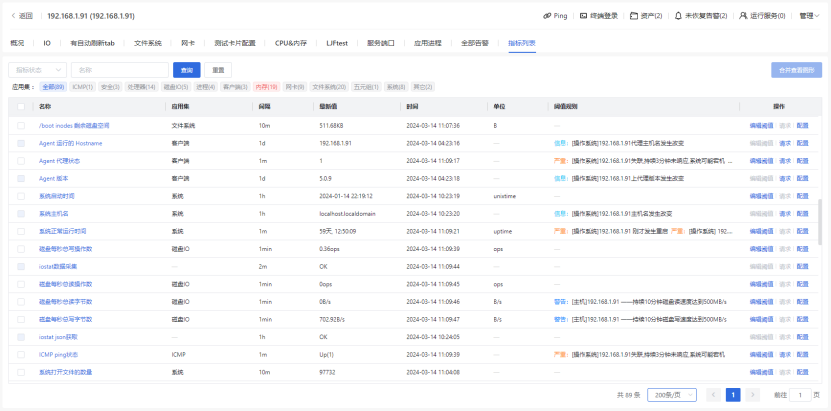
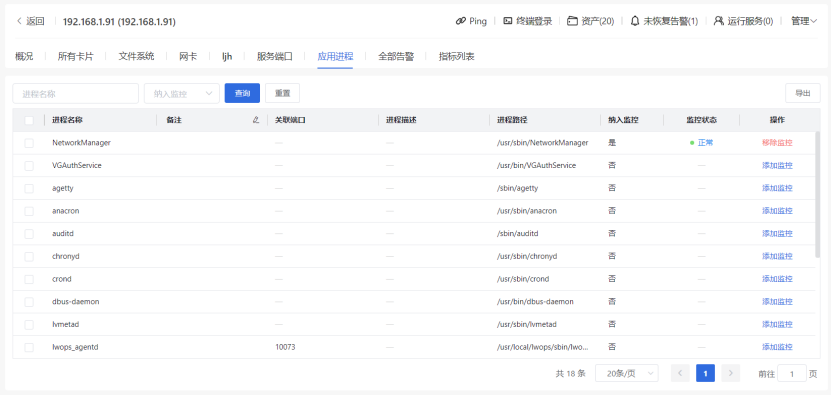
04 Application Process Monitoring
New application process monitoring supports individual monitoring of application processes and service ports on operating systems, automatically triggering alerts when certain processes disconnect.
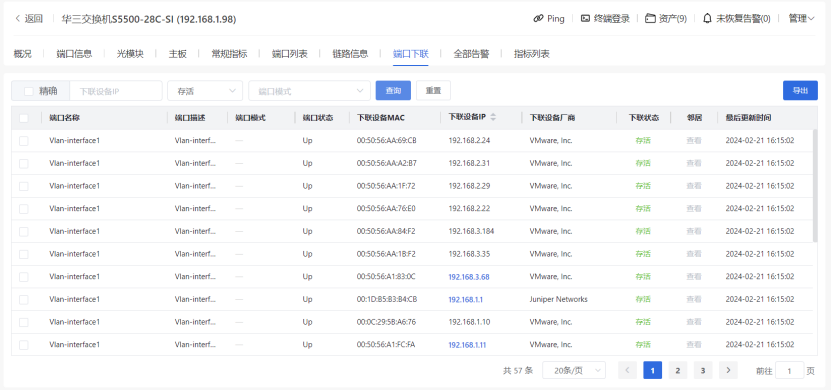
05 Network Device Port Downlink
The port downlink feature for network device management displays which devices are directly or indirectly connected to network ports by combining information from the network device’s LLDP neighbor table, ARP table, and Mac table. Displayed information includes port name, port description, port mode, port status, downlink device Mac, downlink device IP, downlink device manufacturer, downlink status, and neighbors.
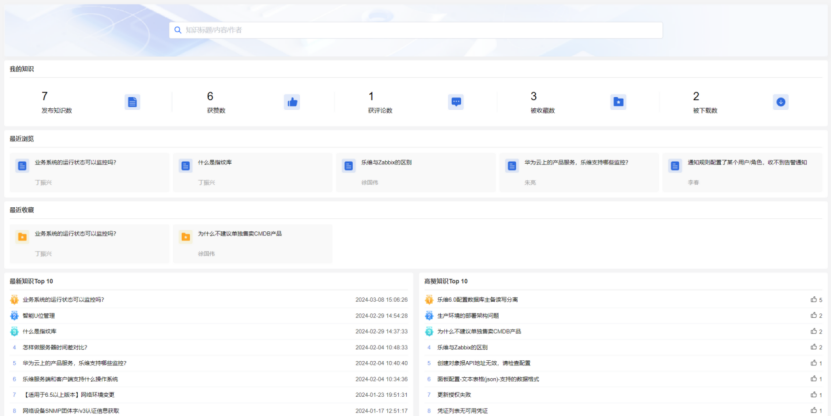
06 Knowledge Portal: Knowledge Management Entry Point
As the entry point for knowledge management, users can quickly search for target knowledge content through the Knowledge Portal’s search function, improving information retrieval efficiency and accuracy, promoting knowledge sharing and dissemination, and enhancing personal and organizational learning and work efficiency.
07 Knowledge Review: Ensuring Content Quality
To ensure the accuracy, reliability, compliance, and security of knowledge, the new version introduces a knowledge review feature. Operations knowledge uploaded by users must be approved by a knowledge administrator before being displayed in the shared knowledge section.
Leviwatch is dedicated to the field of digital operations and maintenance, striving to create the “first entry point” for digital operations and maintenance, providing customers with exceptional products and services. Currently, the Leviwatch Intelligent Monitoring Platform has developed comprehensive full-stack monitoring capabilities (covering over 500 vendors and 6,000 models, a 67% year-over-year increase), unified alerting capabilities, fault diagnosis capabilities, visualization capabilities, business service capabilities, and decision support capabilities. It offers a full-process, one-stop operations and maintenance management service covering monitoring, management, control, and services, while meeting the information security compliance requirements of government agencies, finance, telecommunications, power, and other critical sectors and institutions.
Looking ahead, Leviwatch will continue to delve into customer scenarios, explore customer needs in-depth, and continuously enrich and improve product functionalities to provide users with an extraordinary product experience.
Tips:
In addition to monitoring, Leviwatch’s full range of intelligent operations and maintenance products are also available. Welcome to experience them!
- Lerwee Encyclopedia: What’s IT Monitoring? Why Monitor in O&M?
- 重磅 | 樂維自研採集平臺Perseus正式發佈
- Lerwee NMS VS Solarwinds NPM: Network Performance Monitoring (Part 2)
- A Comparative Analysis of Lerwee Network Management and SolarWinds
- Essential O&M Tool: Server Monitoring Insights
- 监控新势力VS传统实力派:乐维智能监控为何能替代Tivoli?