
Lerwee NMS vs. Solarwinds NPM: Network Performance Monitoring (Part 1)
In the current era of accelerated digital transformation, the network serves as the core hub of an enterprise’s IT architecture, and its stability and performance directly determine the continuity of business operations. Network performance monitoring has become an indispensable tool for IT operation and maintenance teams. As two widely recognized network management tools in the market, Lerwee NMS and Solarwinds NPM each occupy a prominent position with their unique functional advantages.
To assist enterprises in conducting a more comprehensive and detailed evaluation of these two products, the author will release a series of comparative articles. As the first installment, this article will focus on in-depth analysis of three core dimensions: network device monitoring, device connection relationships, and network topology maps, providing enterprises with intuitive references for product selection.
I. Network Device Monitoring: A Competition Between Coverage Breadth and Discovery Efficiency
Device monitoring forms the foundation of network management, and its core lies in the ability to quickly and comprehensively incorporate various heterogeneous devices into management. This directly impacts the work efficiency of the operation and maintenance team and the control of monitoring blind spots.
1. Lerwee NMS: Outstanding Advantages in Localized Adaptation and Full-Stack Coverage
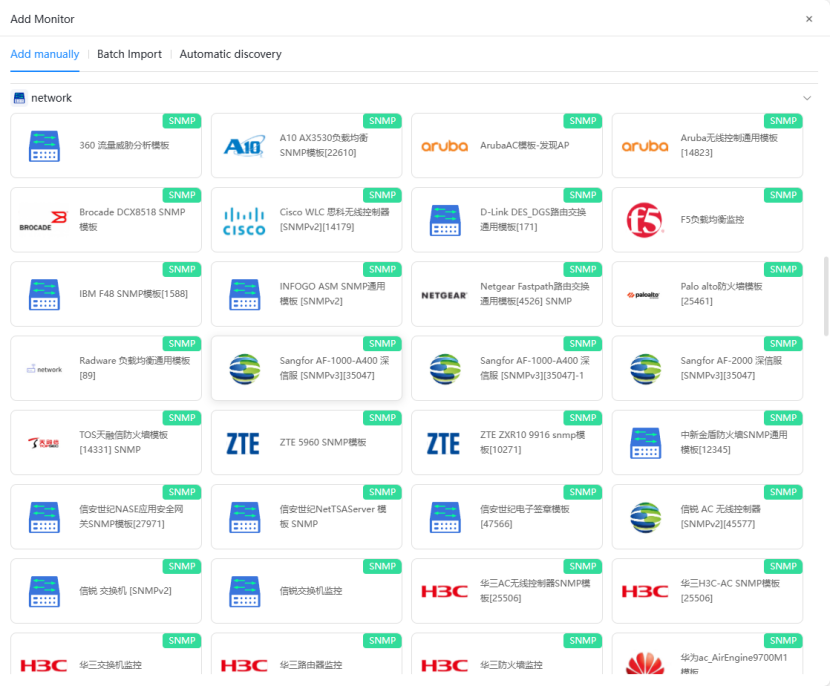
- Intelligent One-Click Discovery Capability: It adopts a lightweight one-click discovery mechanism. Operation and maintenance personnel only need to input the target IP address segment and corresponding management credentials (such as SNMP protocol parameters, SSH accounts, etc.), and the system will automatically initiate the scanning process. Its core advantage lies in the compatibility with multiple types of devices. It can not only identify traditional network devices (firewalls, switches, routers) but also cover non-network nodes such as servers (Windows/Linux), storage devices, and IoT terminals. It is widely compatible with domestic and foreign manufacturers, including mainstream domestic brands like Huawei, H3C, and Sangfor, as well as international manufacturers such as Cisco, Juniper, and Fortinet. This meets the monitoring needs of hybrid IT environments.
- Monitoring Scope and Depth: It focuses on the centralized management of network and security devices, and provides in-depth monitoring support for devices from domestic security manufacturers such as Ruijie, ZTE, Topsec, NSFOCUS, and Venustech. It can collect basic indicators such as device CPU, memory, and interface traffic.
- Full-Stack Monitoring Ecosystem: Relying on a large device gene database, it has achieved adaptation to over 500 manufacturers and more than 8,000 device models. The monitoring scope extends from underlying operating systems and network devices to IT full-stack resources such as virtualization (VMware, KVM), containers (Docker, K8s), and storage systems, truly realizing “managing the entire domain with one platform”.
2. Solarwinds NPM: Protocol-Driven and Customized Monitoring
- Strategic Discovery Mechanism: It adopts a scheduled discovery mechanism, supporting device scanning based on protocols such as SNMP (v1/v2c/v3), ICMP, and WMI. The discovery frequency (e.g., hourly, daily) can be configured as needed. The scanning results need to be manually reviewed before being incorporated into monitoring, enabling controlled automated management. For devices that do not support standard protocols, customized monitoring is required through tools like Universal Device Poller, and in-depth integration necessitates the development of plugins using the Orion SDK.
- Characteristics of Monitoring Scope: It natively supports in-depth performance collection for devices such as F5 BIG-IP, Cisco ASA/Nexus, and Palo Alto firewalls. Meanwhile, through API or SNMP integration, it can effectively monitor key indicators of architectures like Cisco SD-WAN (Viptela) and VMware SD-WAN (VeloCloud).
- Ecosystem Expandability: Functional expansion mainly relies on the modular architecture of the SolarWinds Orion platform and the plugin ecosystem in the Orion Marketplace. For domestic devices such as Sangfor and Topsec, support is usually achieved through custom SNMP monitoring or third-party templates.
II. Device Connection Relationships: Differences in Visualization and Correlation Analysis
A clear understanding of device connection relationships is crucial for quickly locating network faults (such as link interruptions and loops). The two products have different focuses in presenting connection relationships.
1. Lerwee NMS: Intuitive Display of Port-Level Downlink Relationships
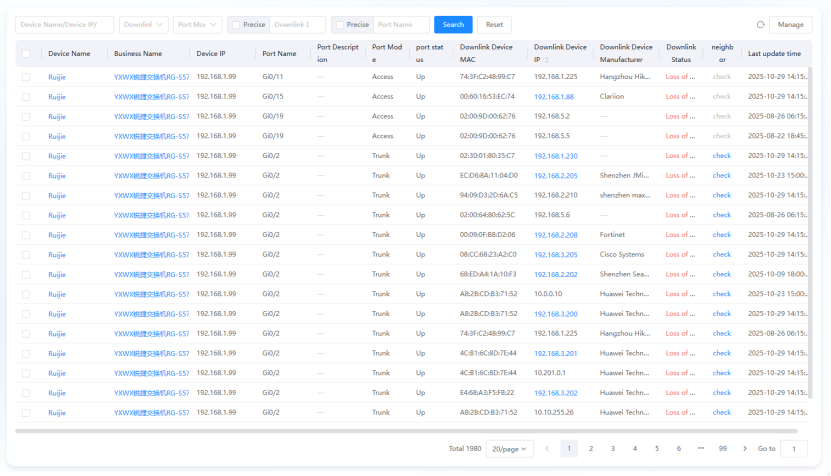
It focuses on the visualization of port downlink functions. On the device details page, it can directly display downlink device information for each network port, including key data such as the downlink device’s IP, MAC address, manufacturer model, and neighbor device name. It can even display the online status and interface traffic of the downlink device in real time. This refined display method allows operation and maintenance personnel to obtain core information without switching between multiple pages when troubleshooting issues such as “disconnection of a port’s downlink device” and “bandwidth bottlenecks of a specific link”, significantly improving fault location efficiency.
2. Solarwinds NPM: Hierarchical Aggregation of Correlation Relationships
It adopts a “node-centered” context display logic, which can automatically correlate and discover the physical and logical relationships between the device and other related routers, switches, servers, interfaces, disk volumes, and groups. The associated objects are presented in the form of visual icons, and their health status (normal, alarm, offline) is reflected in real time.
III. Network Topology Maps: A Confrontation Between Automatic Discovery and Scenario-Based Display
The network topology map serves as a “visual map” of the network architecture, and its accuracy and flexibility directly affect the operation and maintenance personnel’s understanding of the network structure and the efficiency of fault troubleshooting.
1. Lerwee NMS: Leading in Protocol-Driven and Feature Richness
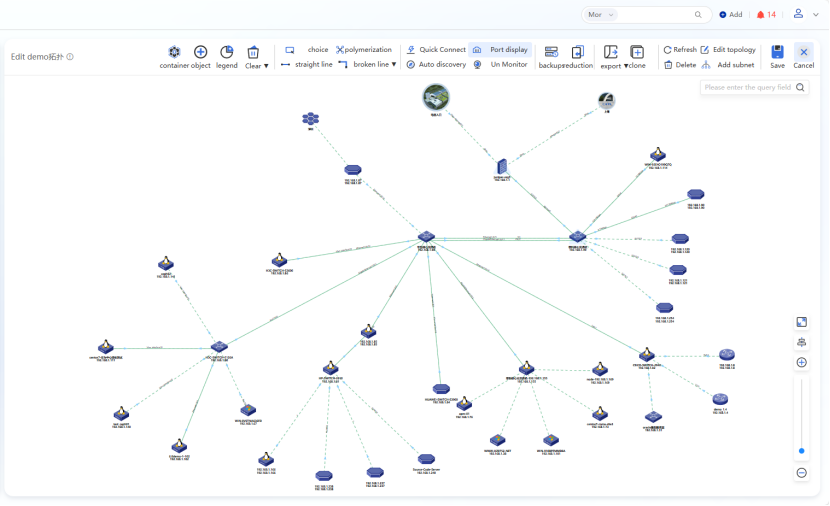
- Multi-Protocol Automatic Discovery: It realizes automatic topology mapping based on a combination of multiple protocols such as CDP (Cisco Discovery Protocol), LLDP (Link Layer Discovery Protocol), and ARP. It can not only discover the connection relationships between network devices but also simultaneously incorporate servers and storage devices into management during the discovery process, forming an integrated topology of “network-server-storage”.
- Hierarchical Structure and Operability: It supports the hierarchical display of topology maps. By double-clicking the core switch, you can drill down to the downlink subnet topology, clearly presenting the hierarchical architecture of the network. At the same time, it provides topology backup, restoration, and cloning functions, facilitating the preservation of network structures at different periods (e.g., before and after changes). It also has refined topology permission management, allowing the assignment of different topology viewing/editing permissions according to departments and roles to ensure operation and maintenance security.
- Special Monitoring for Aggregated Links: For the common link aggregation (LACP) scenario in the network, it can automatically identify aggregated interfaces, display indicators such as the total bandwidth and traffic utilization of the aggregated interfaces, and simultaneously show the status and performance data of each member interface. When a member interface fails, it can issue an alarm in real time, avoiding potential risks caused by abnormalities in the members of the aggregated link.
2. Solarwinds NPM: Scenario-Based Topology and Nested Display
- Automatic Mapping of L2/L3 Connection Relationships: It can automatically discover and display the connection relationships (L2, L3) between devices, and the topology map can intuitively distinguish the link types at different levels.
- Creation of Scenario-Based Multi-Layer Topologies: It supports the creation of nested multi-layer topology maps based on business scenarios, for example, dividing topologies according to dimensions such as region, department, floor, building, computer room, and cabinet.
- Limitations: It does not yet support the special display function for aggregated links, and the association relationship between the aggregated interface and member interfaces cannot be directly viewed in the topology map. Relevant information needs to be obtained indirectly through the device details page, resulting in monitoring blind spots for network environments that rely on link aggregation.
IV. Summary
- In terms of device management capability, both products can cover mainstream devices. Lerwee NMS has more comprehensive localized adaptation and strong support for international high-end devices and emerging architectures, while Solarwinds NPM lacks localized adaptation.
- In terms of functional modules, Lerwee NMS has more built-in modules, and functions such as aggregated link monitoring are ready to use out of the box, while Solarwinds NPM needs to rely on plugins for expansion.
- In terms of discovery efficiency, the one-click discovery capability provided by Lerwee NMS is more convenient, while Solarwinds NPM is more suitable for periodic monitoring.
- How to replace SolarWinds to ensure enterprise IT security?
- SSL Certificate Automation: Total Game-Changer
- Visual network traffic analysis
- Lerwee NMS vs. Solarwinds NPM: Network Performance Monitoring (Part 1)
- zabbix与乐维监控对比分析(三)——对象管理篇
- A Brief Discussion on the Differences Between Zabbix and Prometheus